First Published on Firstlinks – Link Here
Several times in the past twelve months investors have been offered dire warnings from well-regarded bank analysts that the share prices of the major Australian bank stocks were over-valued and headed for a big fall and that prudent investors should sell all of their bank shares. These warnings were echoed in the financial press as CBA’s share price pushed through $130 per share and questions why Australian banks should rank among the most valuable global banks based on market capitalization. While the current sell all banks call in 2024 is based on valuation grounds, this trading advice has been given regularly by the investment banks, most recently in 2020 (Covid-19 will see unemployment spike and house prices crash) and in 2022 (fixed interest rate cliff).
For an institutional investor one of the most difficult decisions, one faces is how much of the portfolio should be allocated to Australian banks. Currently, the Australian banks account for 22% of the ASX 200 or 24% when Macquarie is included, following strong profits, large share buybacks, and low bad debts across their mortgage portfolios.
In this week’s piece we are going to look at look at the change in the lists of the most valuable global banks over time. Generally appearing on these lists results in subsequent share price underperformance and raises the question whether the Australian banks are headed for a fall.
A Look Back in Time
Looking back at the lists of the largest banks in 2015, 2005, 1995, and 1985, the banks that dominated these lists generally performed very poorly in the following decade. In the early 1980s four of the top 10 banks were French, all of which were later nationalised by the Mitterrand government.

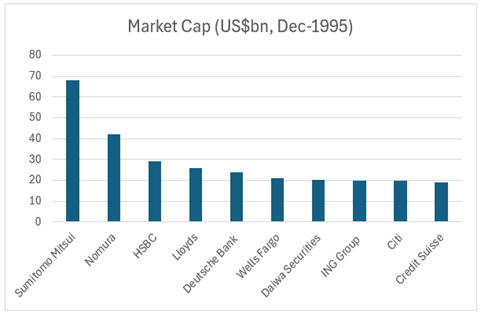
By 1995 the French banks had all fallen off the list, which was now dominated by Japanese Banks like Sumitomo Mitsui, Nomura and Daiwa. These banks were viewed at the time to be taking over the world as Japanese investors bought up assets from the Rockefeller Centre to Gold Coast apartment blocks. The bursting of the overheated Japanese asset price bubble resulted in massive non-performing loans and several Japanese banks’ failure.

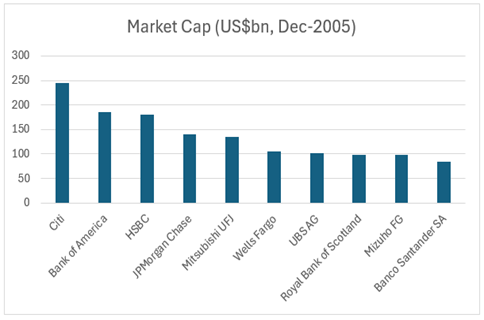
The chart above shows the list of the top banks by size as of December 2005. The list was dominated by US and European banks, as investors wanted exposure to innovative banks whose expertise at structuring complex financial products seemed to generate a stream of very strong profits with minimal risk. The financial crisis 2007-08 brought on by the bursting of the US housing bubble was very unkind to these banks, with the bulk of them being forced to seek state bail-out packages to ensure their solvency. Indeed, the largest bank on the list, Citibank, has a share price that currently sits -85% below what it was in December 2003, thanks to a dilutionary bail-out that saw the US taxpayer take a 36% equity stake in the bank.
The high-flying Royal Bank of Scotland’s (8th largest bank in 2005) fall from grace was sharper than most with its share price falling 96% between 2007 and 2008 and was bailed out by UK taxpayers in 2008. The combination of the poor acquisitions of Dutch bank ABN Amro, £15 billion in fines and legal costs and £40bn in losses from bad lending, sees the the state still owning 22% of the bank and its market capitalization 80% below what it was in 2005.
Moving on Five Years
In the below graph, we can see that in 2015, USA banks dominated the top five largest banks in the world, but this is where we saw a rise from the Australian Banks (Commonwealth Bank and Westpac), HSBC and a Canadian bank (Royal Bank of Canada) break into the top 10 largest banks in the world. Canadian banks operate in a similar regulatory and economic environment to Australian banks, as well as deriving a large majority of their revenues from mortgages. In Canada, six large banks (RBC, TD, Scotiabank, MBO, CIBC, NBC) control around 93% of the market similar to the Australian Big Four. The leader from 2005 Citi still remains on the list, though has shed $100 billion in market capitalization during the 10-year period.

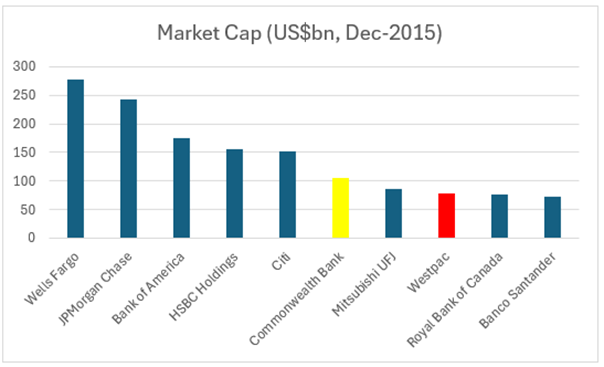
There is an argument that in decade to 2015, HSBC along with the Australian and Canadian banks didn’t grow into the top 10 banks in the world, but rather, other banks self-destructed around them or were still recovering from the global financial crisis.
What Happens Next?
Looking back, owning the largest and most loved banks in 1985, 1995, and 2005 proved to be a poor investment decision in the following decade. However, the 2015 list has many names that remain the largest banks to 2024, but in different rankings.

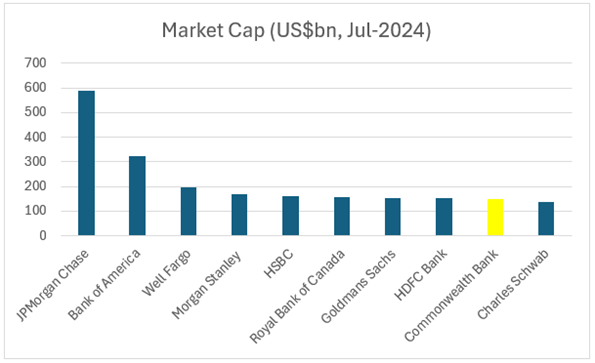
Most of the biggest banks in the world are from the US, with the US banks deriving less than half of their profits from mortgages, with most coming from other arms of the banks. The remainder of the list is made up with from Canada (RBC), India (HDFC) and Australia’s CBA. Interestingly none of the Australian banks are considered by the Financial Stability Board (FSB) to be globally significant banks, despite CBA (market capitalisation A$216 billion) being significantly larger and more profitable than the globally significant Deutsche Bank (market capitalisation A$44 billion). Consequently in July 2024 many investors are calling the Australian banks, especially CBA overvalued and that investors should short sell the major banks.
The Widow-Maker Trade
A “Widow-Maker” trade in the hedge fund world is a short-selling of an overvalued asset that may make sense intellectually, but the share price continues to rise in spite of the bearish investment thesis. As it continues to rise, the short seller is forced to post ever-increasing amounts of cash into their margin account, increasing the chance that the fund manager has a heart attack or gets fired.
US and European fund managers have been systematically shorting Australian banks based on the seductive story that they are overvalued compared to their domestic peers. International investors have historically made mistakes by thinking Australian banks operate in the same regulatory environments as their domestic banks. The basis for their thesis is that four banks from a small backwater in the financial world have little business, being amongst the largest in the world.

How Aussies Banks are Different from Global Banks
The big four Australian banks control around 75% of the domestic lending market and enjoy higher barriers to entry due to the high level of regulation placed on them. Conversely in the USA there are over 4,000 registered commercial banks, with the top 5 (Wells Fargo, Bank of America, U.S Bank, JP Morgan Chase and PNC Bank) having a market share of only 7%.
While the number of banks in the USA sounds like a preferable market structure to the Australian banking oligopoly, this is only due to previous regulations that precluded banks from opening branches outside their home state. This results in a large number of small and often financially precarious banks with limited geographic diversification and can lead to frequent bank collapses such as Silicon Valley Bank in 2023. Conversely the last bank collapse in Australia was the State Bank of South Australia in 1991.
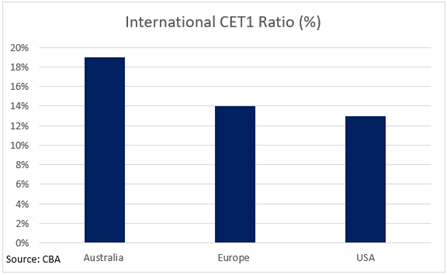
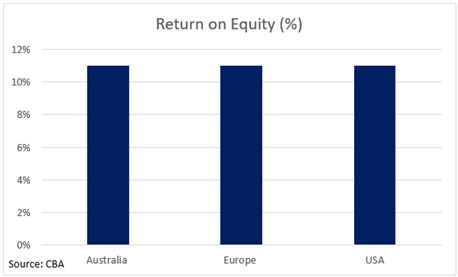
Additionally, the Australian banks are regulatory made to be better capitalized leading to lower loan losses through the cycle and are more consistent profitability than their US or European peers due to low impairment and provision charges.


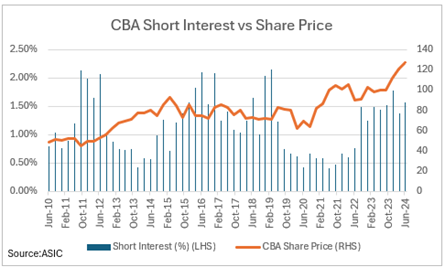
Betting against the buybacks
Due to strong capital ratios built up post-banking Royal Commission through COVID-19, the big four Australian banks are now well capitalized and have begun large share buyback schemes. ANZ has announced a $2 billion buyback, a $1 billion CBA buyback, a $2 billion NAB buyback and a $2 billion Westpac buyback. For investors, this will support the share price over the short term with a buyer always being in the market every day to hold up the day-to-day share price. Not only will it support the share price, but it will also reduce the amount of outstanding shares to divide next year’s profit by.
The banks all normally commit to neutralizing their dividend reinvestment plans, which will see banks buy shares on the market and give them to shareholders instead of issuing new shares to shareholders. This may sound insignificant, but across the May 2024 dividend schedule, Atlas estimated $900 million worth of shares were bought to support the neutralization.
Our Thoughts
The Australian banks have successfully generated record profits from their domestic franchises, which have operated in a cozy banking oligopoly over the past decade. Recently, competition from non-bank lenders has increased due to the rise of private credit funds in this higher interest rate environment. Despite this increased competition, banks’ bad debts remain at all-time lows, and profits continue to be strong.
What caused the French, Japanese, and US banks to explode in the late 1980s, 1990s, and 2000s was rapid lending expansion into new areas that, in hindsight, their management teams did not fully understand. Australian banks have learnt from their previous mistakes around international expansion and are focusing on their domestic markets, in which the banks generally have a strong history of profitable business.
Whilst Australian housing can be viewed as expensive globally, Atlas sees a range of factors that strongly incentivize Australian households to maintain mortgage payments. These include recourse lending, homes being exempt from capital gains tax and a very strong cultural desire to own one’s own home, which means that bad debts should remain quite low. Although bad debts will remain low, banks are likely to see continued mortgage competition that will reduce their interest margins and profitability growth.
Although, CBA has diverged from its long-run price-to-earnings of 16x forward earnings to over 22 times, Atlas still believes that CBA will have a good result in August with the announcement of further on-market share buybacks. CBA is still the leader for the banks in marketing, technology, customer service, and quality of management and has the highest return on equity, but does it deserve this high of a premium?