n 2021, Australia’s banking regulator APRA warned that banks potentially faced negative interest rates in 2022 and should upgrade their systems to deal with zero or negative market interest rates. A situation not faced by bankers since 1772 BC, when Babylonian king Hammurabi regulated the interest rates that the temple bankers of Babylon could charge to 20%. Instead of the expected discussions about zero or negative interest rates, the May 2022 bank reporting season was dominated by rising rates and talk of expanding net interest margins.
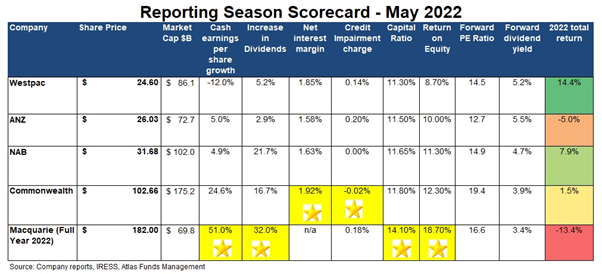
Here, we look at the themes in the approximately 800 pages of financial results released over the past two weeks, including CommBank’s first half 2022 results, awarding gold stars based on performance over the past six months. This article originally appeared in Firstlinks
Recovered from the pandemic
The key feature of the May results for the banking sector was profits trending back to pre-Covid-19 levels. Instead of seeing a steep increase in unemployment and falling house prices as was expected in May 2020, the unemployment rate has continued to decline from 7.5% in June 2020 to 4% in March 2022, with expectations that the unemployment rate will trend lower in 2022. While growth in house prices is now slowing, the median Australian house price as measured by CoreLogic at the end of April 2022 was 37% ahead of the price pre-pandemic in January 2020. Low unemployment combined with growth in house prices had seen the banks record minuscule loan losses in 2022, solid loan growth and profits close to or above those recorded in 2019.
For CBA, their first-half profit of $4.7 billion and earnings per share (EPS) of $2.73 were ahead of the comparable pre-Covid-19 period. Westpac and ANZ remain behind their pre-Covid levels though profits continue to recover. NAB’s headline profit ithis year was ahead of May 2019, though EPS still lag due to a dilutionary $3.5 billion capital raising conducted in April 2020 to strengthen the bank’s capital base anticipating losses. In May, the gold star is awarded to Macquarie Bank, which grew profits by 10% in 2021 and then by 51% in 2022. Macquarie has benefitted from market volatility in their trading business, M&A fees, and management fees from their $775 billion assets under management.
Gold Star – Macquarie
Show me the money!
Excess capital and share buybacks continued to be a feature of the results season, an unthinkable situation two years ago when banks were either cutting dividends or raising capital in the expectation of heavy loan losses that would erode their capital base. All banks increased their dividends over the first half of the 2022 financial year. Additionally, share buybacks were conducted or announced in 2022 by Westpac ($3.5 billion), CBA ($2 billion), NAB ($2.5 billion) and ANZ ($1.5 billion). All banks have a core Tier 1 capital ratio well above the APRA’s ‘unquestionably strong’ benchmark of 10.5%, aided by asset sales in wealth management and insurance, lower than expected loan losses and meagre dividends in 2020 and 2021.
We expect further buybacks in 2022 if the environment remains benign, though recognising that the optics of banks increasing dividends and conducting buybacks while raising mortgage rates could be challenging and attract negative political attention. However, as all banks have sold businesses primarily in wealth management, buying back shares neutralises the impact of lost earnings and dividends per share by reducing the number of shares on issue. Additionally, management teams are incentivised to buy back shares rather than offer the sugar hit of a special dividend. Reducing equity makes it easier for them to hit their return on equity (ROE) targets which triggers performance bonuses. In the words of Charlie Munger, “Show me the incentive, and I’ll show you the outcome”.
Gold Star – Banking Oligopoly
Net interest margins
Net interest margins (NIMs) were a major topic this reporting season and the primary source of optimism despite all banks reporting falling NIMs and historically low margins on lending. The source of this optimism was the RBA raising the cash rate in May for the first time since November 2010. As you can see from the below chart sourced from Richard Coppleson, the cash rate has been trending down consistently since 1988.
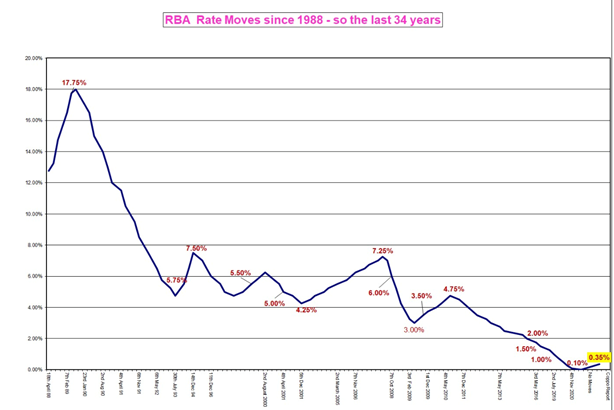
When the prevailing cash rate is 6%, it is much easier for a bank to maintain a profit margin of 2% than when the cash rate is 0.1%. Falling interest rates reduce the benefits banks get from the billions of dollars held in zero or near-zero interest transaction accounts that can be lent out profitably. In May, Westpac revealed they have $601 billion in customer deposits (earning between 0% and 0.5%), enough to fund 83% of the bank’s net loan book. This deposit pool reduces the bank’s need to fund lending by borrowing at higher rates from the wholesale money markets.
In a rising rate environment, this pool of deposits held in transaction accounts and term deposits will continue to be a cheap funding source and should allow bank NIMs to expand. Last week, when the RBA raised the cash rate, all banks responded by passing this increase on to their variable lending rates, though we saw no movement in the 12-month term deposit rate (still at 0.25% to 0.5%) or cash accounts (mostly at 0%). We calculate that a 0.25% rise in interest rates equates to a 3-4% increase in profits for the banks due to an expanding NIM.
The banks more heavily exposed to mortgages (CBA and Westpac) traditionally have higher margins than the business banks (NAB and ANZ) which face competition from international banks when lending to large corporates. CBA posted the highest NIM for the first half with 1.92%, and the other banks reported falling NIMs for March 2022. However, there was a palpable sense of optimism from bank management teams towards their NIMs over 2022 and beyond as they face the first rising interest rate cycle since the initial Rudd administration.
Gold Star CBA
Expenses
Managing expenses was another central theme, with the market expecting growth in expenses predominately due to low unemployment contributing to wage growth. Additionally, compliance teams have grown in response to fines from AUSTRAC for not complying with the Anti-Money Laundering and Counter-Terrorism Financing Act 2006 and after the 2018 Banking Royal Commission. Westpac’s expenses were under the microscope in May after surprising the market in November 2021 with expenses that were 8% higher than expected due to the addition of 3,000 new staff and consultants temporarily to set up new financial crime and complaints handling procedures and meet other regulatory obligations. This saw Westpac’s share price fall 10%, as analysts assumed these additional expenses would be mostly permanent.
While there was minimal discussion around cutting expenses through branch closures, it is clear that the banks have been utilising Covid-19 to rationalise their footprint. We view the rationalisation of branch networks to be the easiest way for banks to grow earnings and contain expense growth. The major banks have between 1,000 and 800 branches each around Australia, but there has been a significant decline in their usage over the past decade, as most transactions are now conducted online. Indeed, NAB reported processing 1,300 digital transactions for every in-person transaction conducted at a branch. In May, Westpac was the only bank to detail changes to their branch network, revealing that 70 branches have been closed over the past year, showing benefits in reducing expenses in coming years.
While ANZ and NAB kept expenses unchanged (an excellent outcome in an inflationary environment), we award the gold star to Westpac for controlling costs (reducing expenses by over $600 million).
Gold Star Westpac
Our take
The May reporting season showed that Australia’s banks are in good shape and face a better outlook than many sectors of the Australian market. One of the major questions confronting institutional and retail investors alike is the portfolio weighting towards Australian banks, with the banks comprising 25% of the ASX 200. We expect the banks to outperform in the near future, enjoying a tailwind of a rising interest rate environment and very high employment levels and minimal exposure to events in Europe.
Rising interest rates will see declining discretionary retail spending as a higher proportion of income is directed towards servicing interest costs. While bad debts will increase, this is expected with bad debt charges between 0% and 0.2%, currently at the lowest in Australian history and far below historical averages of 0.35%. In any case, bank loans will be priced assuming higher bad debts. Additionally, bank share prices are likely to see support over the next 12 months from further share buybacks and higher dividends.