In August most listed companies in Australia reported their profit results for the six months ending in June. This period has arguably been the most challenging for real estate ever. At no stage during the 1992 recession or the GFC were large sections of the economy closed by the government and Australia’s borders effectively sealed. While the shopping centre trusts saw significant declines in earnings, many other property trusts were far less impacted from CV-19 than was feared during the dark days of March.
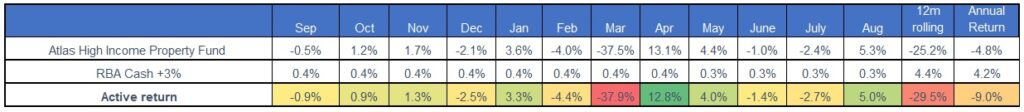
The Atlas High Income Property Fund gained by +5.3% in August, a pleasing outcome as many companies in the Fund reported stable earnings, paid distributions and were quietly optimistic for 2021. A common theme from reporting season was that business conditions have continued to improve since June, with tenants paying rent and new leasing deals being signed.
In an environment where interest rates are close to zero, we see that in the near future, the market will re-rate property trusts that can deliver a stable stream of dividends to investors. What the August reporting season demonstrated was that real estate is not a homogenous asset, with some landlords seeing a minimal impact from CV-19.
Go to Monthly Newsletters for a more detailed discussion of the listed property market and the fund’s strategy going into 2020.
Nathan Bell, head of research and portfolio management at Investsmart, highlights the travel sector which saw airlines and travel retailers at the epicentre of the COVID-19 storm. “You could hear the desperation in Alan Joyce’s voice as he pleaded for state borders to reopen after announcing a $4 billion loss”.
The August 2020 reporting season was always going to be very unusual, dominated not by company-specific factors, but instead by rising political tensions, unprecedented fiscal stimulus plans, travel bans and government-mandated shutdowns. The impact of COVID-19 on our society over the past six months almost surely was outside of the disaster planning scenarios of both companies and investors alike.
Against this challenging background, markets were expecting horrific financial results and large losses as we enter this reporting season. Outside of travel-related companies, corporate results ended better than expected. In this week’s piece, we look at key themes coming out of the August 2020 reporting season.
More information than usual
Despite the uncertainty, many ASX-listed companies have improved communications with their shareholders, with some companies including Transurban and Sydney Airport giving monthly updates on operating performance which looked very dramatic in April and May. On the positive side of the ledger JB Hi-Fi, Coles and Wesfarmers provided out of cycle updates, highlighting sharp increases in revenue during lock-downs. Traditionally, Australian corporates may only offer a relatively bland update in May between presenting their first-half profit results in February and their full-year results in August.
Additionally, most companies are “in blackout” and don’t communicate with investors between late May and reporting results in August, a state of events that were different in 2020. This quiet time has been instituted to avoid giving institutional investors an advantage over retail investors, as being able to ask a CEO questions in private while their company’s financial reports are being compiled could provide reliable and profitable clues as to whether a company is likely to outperform or underperform expectations on results day. In the August 2020 reporting season, there have been fewer surprises (especially negative ones) than usual due to the higher levels of investor communication brought on by Covid-19.
Bad News out of the Way Early
A key theme in 2020 has been companies first introducing bad news in June and July and then delivering positive news flow on results day in August. This theme was seen in QBE, Worley Parsons and Coca-Cola’s results, all of which provided gloomy predictions and asset impairments in July and June. In August, these companies saw a strong rebound in their share prices as their financial results offered some positives and the company paid a dividend that was higher than the market had expected.
Minimal Guidance
Against this background of uncertainty, 70% of the companies that have reported in August 2020 have either not issued earnings guidance or have withdrawn profit guidance for the upcoming year. With increasing class-action lawsuits challenging listed company continuous disclosure reporting requirements, the refusal to provide earnings guidance during heightened economic uncertainty is understandable.
When a company reports an adverse event that results in a steep fall in share price, it is now common practice for lawyers to seek damages on behalf of investors, arguing that losses were solely due to the failure of the company to keep the market appraised of adverse events. The class action funder then takes a percentage of the settlement, which can reach as high as 45% of the total award if the case reaches a courtroom. For example, in 2018 Woolworths faced a $100 million lawsuit, alleging that the company was in breach of its continuous disclosure obligations. In early 2015, Woolworths’ shares fell after management informed the market that profit growth for the year would be below the previous guidance of between +4 and +7% growth over the previous year. This change was attributed to a management decision to lower prices to win market share back of Aldi and Coles, rather than maximise short-term profit.
In recent years Australia has become one of the most favourable jurisdictions in the world for shareholder class actions, attracting both domestic and foreign litigation funders and raising reporting guidance anxiety for locally listed corporates. In late May the government responded to the elevated uncertainty of COVID-19 by relaxing the continuous disclosure obligations under the Corporations Act 2001 for six months. However, the raft of outstanding lawsuits, rising insurance costs for company Directors and Officers and the expiry of the shield in November must surely have made companies wary of issuing guidance.
The Haves and Have Nots
The CV-19 pandemic has not been uniformly bad for all Australian companies. In contrast to travel-related companies (including Sydney Airport, Flight Centre and Qantas) and listed property trusts with shopping centre assets (Vicinity Centres) that have seen significant revenue and share price declines over the past six months, a range of companies have performed well ahead of expectations in 2020. Electrical retailer JB Hi-Fi, hardware and office retailer Wesfarmers, AfterPay and Domino’s Pizza all saw record profits over the past six months, benefiting from elevated online spending and consumers staying at home over the lockdown period.
Government Handouts
Cash handouts from the government have been a significant feature of the August results season, although generally not openly discussed. Programs such as JobKeeper and higher JobSeeker payments have assisted consumer plays such as JB Hi-Fi and AfterPay, as cash payments from the government have supported retail sales, despite the significant rise in the unemployment rate. Premier Investments’ result attracted a large amount of commentary in the press after reporting a record profit on the back of strong online sales, maximising JobKeeper subsidies and rent waivers. However many other companies Including Crown, Sydney Airport, Tabcorp, Carsales.com and Cochlear, have also benefited from stimulus plans in 2020 without receiving the same level of media attention.
Best and Worst
Over the month, the best results were delivered by JB Hi-Fi, Amcor, WiseTech and CSL; all of which reported strong earnings growth in a highly challenging macroeconomic background. Reliance Worldwide, Flight Centre, Stockland, Star Entertainment and QBE Insurance all saw strong share price performance after the release of their results, down substantially on 2019 results by better than low expectations.
On the negative side of the ledger Challenger, Telstra, Seek, Bendigo Bank and AGL Energy all saw weak share price performance over August. The common themes amongst this group were the profit results weaker than expectations combined with bearish management commentary for the coming year, mainly due to the inability to reduce costs in line with revenue falls.
Treasury Wine’s share price also fell in August, not due to their results which were quite solid, but rather on news that China’s Ministry of Commerce has launched an investigation into “dumping practices” of Australian wine producers into China. Wine is now expected to join beef and barley on the 2020 list of Australian goods attracting tariffs when imported into China, a material event for Treasury Wines that derives 40% of their profits from the Chinese market.
Our take
In aggregate the August results season was better than expected, with a number of companies in the Atlas Portfolio delivering profits ahead of estimates and a few companies paying unexpected dividends. What was clear from the August financial reporting season was that the CV-19 pandemic had impacted Australian companies to varying degrees. This contrasted to the dark days of March 2020 with the median return for the 200 companies comprising the ASX 200 was down -23%, on investor fears that CV-19 would be very damaging for all companies, irrespective of their business model or industry. Indeed, some of the apparent winners from COVID-19 such as JB Hi-Fi and AfterPay were sold down heavily in March.
In the last week explosives have been a hot topic, after a cache of ammonium nitrate was detonated in Beirut, killing 171, destroying the port and rendering …
In the last week explosives have been a hot topic, after a cache of ammonium nitrate was detonated in Beirut, killing 171, destroying the port and rendering 30,000 people homeless. In the last week many media pundits have had to get quickly up to speed on explosives, but it is not widely known that the ASX is actually the home of explosives, with the two largest explosives manufacturers in the world Orica (ORI) and Incitec Pivot (IPL) listed on the ASX.
In this week’s Torpedo Friday we are going to look at one of the giants of the explosive’s world and the explosives market leader in the largest market the USA, Incitec Pivot (IPL).
Hugh Dive from Atlas Funds Management has 15 years experience in analyzing the global explosives industry and has visited most of IPL’s sites across the globe. Dive explains how IPL came to be on the ASX, major industry movements, the regulation around IPL including use and storage of explosives and IPL as a possible investment.
July saw a volatile month for listed real estate, with the sector up in the first half buoyed by the majority of property trusts paying a distribution in late June and improving retail sales data. However, these gains were reversed on news of rising CV-19 cases in Victoria that ultimately resulted in a lock-down in the southern state.
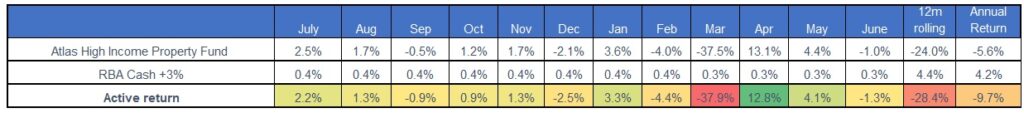
The Atlas High Income Property Fund declined by 2.4% during July, a frustrating outcome as most of the month the Fund was ahead of both the index and in positive territory prior to a sell-off on the last two trading days of the month.
The last six months have seen very negative sentiment towards real estate and a wider-spread de-rating of the sector. While discretionary retailers face a tough outlook; the largest exposures in the Fund are to supermarkets, industrial and infrastructure real estate, assets that have seen either minimal or even slightly positive impacts from CV-19. In late June, 85% of the Trusts in the portfolio that were due to pay a distribution did so, with one deferred to August. This indicates that high levels of rent are being collected and that not all businesses in 2020 are facing the same challenges.
Go to Monthly Newsletters for a more detailed discussion of the listed property market and the fund’s strategy going into 2020.