

Retail property: apocalypse or rebirth?
“The thesis that all shopping malls are ruined and are going down doesn’t account for the changing composition of tenancies,” says Hugh Dive, chief investment manager at Atlas Funds Management. The better shopping centres are changing their tenancy mix to include more services and experiences.
Blog
Understanding Clydesdale Bank (CYBG) on the ASX

CYBG has been a popular pick for value-style fund managers since listing in 2016 under the assumption that the spun-off bank will do better under a focused management team based in England rather than Melbourne and that the English bank will avoid the fall-out from Australia’s Financial Services Royal Commission. Hugh Dive from Atlas Funds Management unpacks the complicated ASX-listed, UK-based bank to understand the company and whether it’s a viable investment through the Quality Filter Model (QFM). Last week CYBG PLC announced a downgrade to its earnings due to an increase in provisions for legacy payment protection insurance (PPI) costs of between £300m and £450m, a substantial increase from what was assumed in July. This saw CYBG fall -12% so far in September. Clydesdale Bank (CYBG) is a mid-sized UK Retail and SME banking group, established in 1838 in Glasgow, it was bought by Nab in 1989 and includes Leeds-based Yorkshire Bank (founded in 1859). CYBG was spun off from NAB in 2016 after a troubled previous decade which had generated a range of write downs and provisions for mis-selling of products dating back to CYBG’s push into Southern England prior to the GFC. In 2018 CYBG acquired Virgin Money (the rebranded failed building society Northern Rock which was acquired by Virgin) for £1.7 billion in an all-stock deal. CYBG is dual-listed on the ASX and LSE.
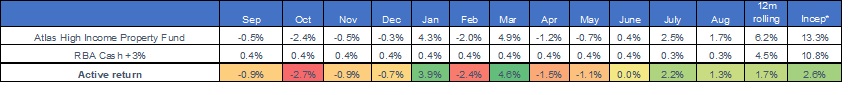
August Newsletter Atlas High Income Property Fund
- The Atlas High Income Property Fund gained by +1.7% during August in a month where all of the Trusts held by the portfolio reported their profit results for the first six months of 2019. Due to our positioning towards higher-yielding rent collectors with recurring income and away from Trusts relying on development profits, the August reporting season provided few surprises.
- Over the past year, a new source of volatility has crept into the market – outrageous Trump tweets, often designed to influence ongoing trade negotiations. Atlas believes that trying to manage a portfolio based on expected Trump tweets would surely result in poor outcomes for investors. What we can control is building a portfolio with trusts that are growing their dividends at a rate both greater than inflation. We were pleased to see that the companies owned by the Fund on average grew distributions by 3% compared with the first six months of 2018.
Go to Monthly Newsletters for a more detailed discussion of the listed property market and the fund’s strategy going into 2020.
AFR: Earnings wrap: profits, dividends and disappointments
Analysis
Earnings wrap: profits, dividends and disappointments
Hugh Dive Sep 2, 2019 — 7.50am
During the months of February and August, the majority of Australian listed companies reveal their profit results, and most provide guidance as to how they expect their businesses to perform in the coming year.
While we regularly meet with companies between reporting periods to gauge how their businesses are performing, during reporting season companies open up their closets to enable investors to have a more detailed look at their financials and ask management probing questions.
Until this happens, investors cannot know with certainty whether skeletons will jump out or if they will see the expected row of neatly ironed shirts.
Friday marked the end of the August 2019 reporting season. Companies with June and December year-ends had until Friday evening to release their financial results for the past six months, or they will be suspended from trading.
In general, company profits have been better than expected, and in this piece we are going to run through the key themes that have emerged over the last three weeks.
Show me the money
Capital management was again prevalent and understandably popular with investors, especially following significant falls in term deposit rates over the past year. Qantas, AGL Energy, Aurizon, Amcor, Link Admin and Brambles announced new share buy-back plans.
Special dividends were announced by the ASX, Suncorp, BHP, Coles and Medibank Private. Several companies also increased their dividend by a greater rate than their earnings per share, thus increasing their payout ratio.
While rising dividends play to the “search for yield” investment theme and provide a short-term boost to share prices, in the longer term companies do need to retain cash to reinvest in their operations to grow earnings in the future without adding to debt.
Across the industrial companies, the dividend payout ratio remains high and is now approaching 80 per cent.
Spending more than expected
Going into the August results season we were concerned that company results would show a dramatic pull-back in retail sales due to falling house prices and political uncertainty.
The financial results for large listed retail property trusts such as Scentre Group give a good insight into consumer spending.
Across Scentre’s portfolio of 41 shopping centres and 11,500 retailers, sales were up 1.3 per cent. Weakness in department stores was offset by sales growth in food, personal services, supermarkets and even fashion.
Elsewhere in retail, JB Hi-Fi saw sales grow 3.5 per cent as consumers opened their wallets to buy phones, gaming consoles and Fitbits; similarly, Tabcorp showed the continued willingness of Australians to bet on horses and play lotteries.
Coles and Woolworths both showed approximately 3 per cent sales growth in supermarkets and liquor.
The areas where consumer spending was weaker than expected included domestic travel, with Flight Centre reporting a decline in Australian leisure travel, though this could be attributed to weakness in the Australian dollar over 2019 which has reduced the attractiveness of foreign spending.
Coca-Cola also saw declining volumes which may be due to overall diminishing consumer appetites for carbonated soft drinks.
Shorts getting burned
While most of the market looks to own stocks that will report a good result and increase their dividends, some fund managers look to capitalise on bad results by short selling.
Of the 10 most shorted stocks at the end of July, only one – A2 Milk – has been profitable for the short sellers. The two largest short positions – Domino’s Pizza and JB Hi-Fi – would have been painful shorts as their prices have rallied over August.
Domino’s Pizza delivered a result that was around market expectations, with sales in Japan and Europe offsetting weakness in Australia.
The last thing a short seller would want to see on results day is a headline saying that the targeted company has delivered net profits above their guidance, which is what JB Hi-Fi did last week.
JB Hi-FI confirmed our view that the company is a world-class electrical retailer, growing sales and profits against a challenging consumer backdrop.
As good as it gets for diggers?
The miners (mainly the iron ore producers) reported strong profit growth in August driven by elevated commodity prices.
Iron ore went from $US71 a tonne at the start of 2019 to peak at $US125 a tonne at the end of June due to the failure of a tailings dam in Brazil that killed 248 people.
This accident resulted in the miner Vale shutting down 40 million tonnes of iron ore production, tightening up the global market for iron ore.
Rio Tinto, BHP and Fortescue all reported solid growth and increased dividends, but this was overshadowed by the 30 per cent fall in the iron ore price since the end of the financial year.
Looking ahead, planned mine expansions (and resultant increased supply), the impact of trade tensions between China and the US, as well as a moderating Chinese demand should see the price of iron ore continue to drift downwards.
On conference calls, management teams from the miners promised to maintain capital discipline, increase returns to shareholders and pay down debt; all sound strategies given the weakening of commodity prices.
What concerned us was the evidence of rising costs apparent in the results of BHP, South32 and Rio Tinto. In 2020, the mining companies could face costs moving higher (particularly labour) at a time when commodity prices are weakening and demand is diminished.
Hugh Dive is the chief investment officer of Atlas Funds Management.
Short Sellers cause a melt-up in August Reporting Season

Short Sellers were caught on the wrong side of the market when Domino’s Pizza (DMP) and JB Hi-fi (JBH) surprised the market with results better than expectations. Hugh Dive from Atlas Funds Management explores the top shorts going into reporting season and how they have performed in August 2019. Dive says “Going into reporting season, as a fund manager, it is always good to look at where other investors are positioned – and in particular those that have a different view to you”. In this interview Dive explains how short selling works, the four steps to shorting and how the “favoured” July shorts have performed in the August and the dramatic impacts of a Short Squeeze on share prices. Domino’s Pizza delivered a result that was around market expectations, with sales in Japan and Europe offsetting weakness in Australia. DMP’s share price has rallied since the result after management gave a positive outlook for 2020, telling the market that sales were up close to 5% over the first 7 trading weeks of the new financial year. The short thesis for DMP was that further deterioration in Australia would cause this high PE stock (PE 25x) to de-rate further. Looking at JBH, when you are short a stock the last thing you would want to see is the company delivering net profits above their guidance, which is what JBH did last week. Overall this was a very solid result from this world-class electrical retailer in a challenging consumer backdrop. 2020 may look better due to a range factors such as declining mortgage rates, tax cuts and a higher credit growth (and household formation from APRA lending changes.