Over the past six months, there have been numerous headlines around rising energy prices and their impact both on curbing global growth and in cutting domestic consumption as the costs of transporting people and goods around Australia were rising sharply. However, instead of climbing as expected, the oil price has collapsed by 30% over the past few months.
In this week’s piece, we are going to look at the beneficiaries of a decline in oil prices. Conceptually a fall in the price of oil is neither positive nor negative per se, but rather a transfer of wealth from oil producing countries and companies (such as OPEC, Norway, Exxon and Woodside) to energy consumers (OECD, South Korea, China, chemical companies and domestic consumers).
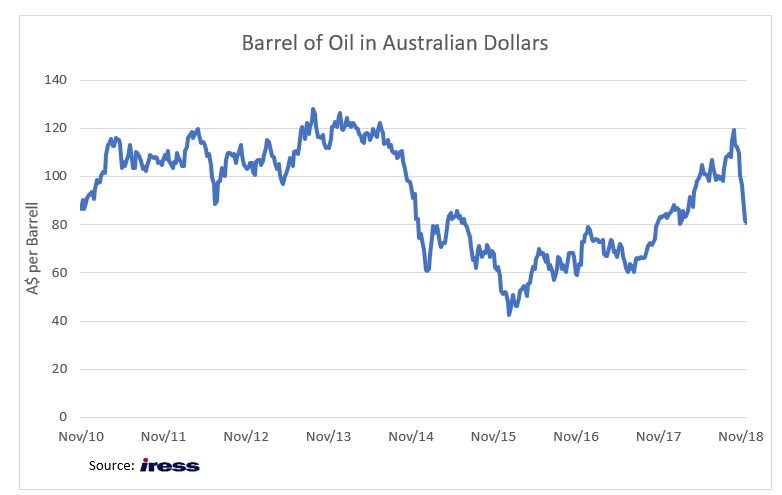
In early October, oil was trading above US$85 per barrel1. The price was forecasted to go above US$100 per barrel as US sanctions on Iran were expected to constrict supply and Saudi Arabia was incentivised to maintain a high oil price to help gain a high price for their upcoming float of Saudi Aramco – see The Biggest IPO of all time.
Over the past two months, the reverse has occurred with oil falling 30% to US$59 a barrel as oil inventories built on higher production out of the USA and Saudi Arabia (due to pressure from Santa Trump), weaker than expected Iranian sanctions and selling from speculators. Saudi Arabia actually lifted oil production in recent months, a move not particularly in their best interests. This has been ascribed both to pressure from President Trump and efforts to mitigate the impact of the journalist Khashoggi’s death in their embassy in Istanbul.
Falling equity markets have also probably played a role in placing downward pressure on the oil price. Macquarie Bank estimated that as a result of the market falls in October and November around $50 billion was withdrawn from commodity funds, which would have resulted in these funds being forced to sell holdings of oil. The chart below shows the price of a barrel of crude oil, for the purposes of analysing its impact on domestic consumers and companies, the price has been converted into Australian dollars.
What Happened
In early October, oil was trading above US$85 per barrel. The price was forecasted to go above US$100 per barrel as US sanctions on Iran were expected to constrict supply and Saudi Arabia was incentivised to maintain a high oil price to help gain a high price for their upcoming float of Saudi Aramco – see The Biggest IPO of all time.
Over the past two months, the reverse has occurred with oil falling 30% to US$59 a barrel as oil out of the USA and Saudi Arabia (due to pressure from Santa Trump), weaker than expected Iranian sanctions and selling from speculators. Saudi Arabia actually lifted oil production in recent month, a move not particularly in their best interests. This has been ascribed both to pressure from President Trump and efforts to mitigate the impact of the journalist Khashoggi’s death in their embassy in Istanbul.
Falling equity markets have also played a role in placing downward pressure on the oil price. Macquarie Bank estimates that as a result of the market falls in October and November around $50 billion was withdrawn from commodity funds. This would have resulted in forced selling of oil held by these funds.
Australian consumers
Australian Bureau of Statistics (ABS) survey reveals that households spend an average of $230 each month on fuel for vehicles. As a result of a falling oil price, motorists in Sydney have seen a litre of petrol fall from $1.65 to around $1.15, which was estimated by Commsec to result in a saving of around $70 per month or equivalent to a 0.25% interest rate cut on an average mortgage. Further falls in the oil price will only increase the impact of this de facto stimulus plan. For example, the sustained lower energy prices consumers saw over the period 2014 to 2016 resulted in an additional $1,100 per annum being added to the average household’s finances when compared to the period 2010 to 2013, with the greatest benefit being felt by those living on the periphery of the country’s major cities. Higher disposable income will also help Australia’s embattled trading banks, as consumers will have a greater capacity to service existing mortgages, keeping bad debts in check.
Higher consumer spending
On the ASX, the largest beneficiaries of the stimulus package of falling petrol prices will be the consumer staples and consumer discretionary retailers, as historically savings at the petrol bowser have been spent on food and liquor, as well as consumer goods such as electronics and clothes. As such, we would expect to see stronger sales figures in 2019 from Wesfarmers, Coles and JB-Hi-FI.
Higher retail sales will also benefit retail listed property trusts such as Vicinity and Scentre as a large proportion of retail spending is still done in bricks and mortar stores. The last twelve months have proven to be very volatile for Australia’s retailers and shopping centre owners. In late 2017, virtually all companies connected to retail saw their share prices fall significantly on news that Amazon was entering the Australian marketplace. The impact of the US e-commerce giant has been fairly muted so far, with Australian retail sales in shopping centres up between 2 and 4% in 2018. Undoubtedly Australian retail sales have been assisted by the government legislating that from the 1st July 2018 online retail sales below $1,000 would be subject to GST, a move that helps level the playing field between foreign websites and Australian retailers .
Large energy users
Among the companies that consume large amounts of hydrocarbons, Qantas is the most obvious beneficiary of a falling oil price. In 2018 Qantas spent $3.2 billion on jet fuel and Australia’s carrier has seen a 25% decline in the price of jet fuel over the past few months. Due to hedging, Qantas will not see the full benefit of this fall in 2019, though the carrier will see a nice boost to profits especially as travellers are still paying over $400 for a one-way flight from Sydney to Melbourne and the flights are all pretty full.
Miners such as Rio Tinto and BHP are both significant consumers of petrol and diesel and sell commodities such as iron ore that is priced independently of the oil price. Moving dirt consumes a large amount of energy in cracking the rocks, removing overburden through explosives, and moving iron ore and coal to the ports on the coasts off Western Australia and Queensland. In the first six months of 2018 higher oil prices reduced Rio Tinto’s profit by $200 million, though the miner should see some relief in the second half of 2018. Previously BHP saw a limited benefit from falling oil prices by virtue of its US onshore oil and gas assets, though these were sold in June 2018 for US$10.8 billion.
Oil importing nations
Whilst falling energy prices will be causing much angst in the oil exporting nations, these declines should provide a boost to the major oil importing economies of China, Europe and Japan. Improving sentiment in the US and Asia will have a bigger impact on the prospects for global growth and Australian exports than oil-induced recessions in Russia, Saudi Arabia, Venezuela or Iran.
The nation that is likely to see the biggest benefit from falling oil prices is China, which in 2017 imported $162 billion worth of crude oil and is the top oil importer globally. Interestingly in 2015, the USA was the largest global importer of crude oil. However, the development of the shale oil industry has reshaped the oil industry, as it has shifted the USA from being an importer to an exporter of oil. Clearly, a factor such as falling oil prices that stimulates the economy of Australia’s largest export partner will have a positive impact on a number of Australian listed companies from miners and tourism operators, to exporters of wine and food.
Our Take
The positive impact of the 30% fall in the oil price over the past two months has not received much attention by the market. There has been a greater focus on what has happened to FANG’s (Facebook, Amazon, Netflix and Google) share price in overnight trading in New York, selling Australian stocks when these are weak.
We see that falling oil prices will provide a nice boost to Australian corporate earnings if maintained for a period. The additional cash from falling oil prices improves the balance sheet of the nation’s consumers, causing either spending on consumption or on paying down debt, and at no cost to taxpayers! By contrast, Kevin Rudd’s “GFC economic security package” from October 2008 delivered a one-off $1,400 to pensioners and $1,000 per child to families and was credited as boosting GDP by 1%, but cost taxpayers $10.4 billion.