IPO Watch Coles

In March Wesfarmers announced their intention to demerge Coles into a new separately listed company, with the new company expected to list on the ASX next Wednesday. Existing Wesfarmers shareholders will receive 1 share of Coles for every Wesfarmers share they own and the parent company will retain a 15% ownership stake in Coles. In this week’s piece, we are going to look at Coles, a new ASX Top 20 company that was last seen as a separately listed company 11 years ago.

As Wesfarmers shareholders, we have closely analysed the 400-page demerger document in an effort to understand how the new company will be structured. Additionally, unlike IPOs (initial public offerings) we like demergers because investing in the newly de-merged child company is frequently very profitable. See our piece Breaking Up. Unlike IPOs where private equity owners are frequently looking to maximise their exit price when a large company is spinning off one of their business units, they are incentivised to give the new company a solid, well-capitalised start with every chance of success. Obviously, when the parent company is giving shares in the new company to their existing shareholders, they don’t want the new company to fall flat on its face just after listing!

History

Coles started life as a single supermarket in Melbourne in 1914 and grew via organic expansion and acquisitions in the supermarket, department store (Kmart), and liquor retailing areas until the company was merged with Myer in 1985 to create Coles Myer. In the 2000s this sprawling retail empire underinvested in their retail offering and underperformed the resurgent Woolworths. This led to management selling the Myer department stores to private equity firm Newbridge in 2006, and Wesfarmers taking over Coles in 2007 in a cash and scrip takeover valued at $19.3 billion. During the last ten years, Wesfarmers have invested in Coles to rebuild their profit margins and improve efficiency to win market share back from Woolworths.

This demerged Coles is not the same as the 2007 version, as Wesfarmers have invested around $9 billion in the Coles business, growing the number of stores and their liquor business. Additionally, the Officeworks, Target and Kmart assets are remaining with Wesfarmers. Essentially the new Coles will comprise three major divisions:

  • A full-service supermarket providing fresh food, groceries and general merchandise with 809 supermarkets throughout Australia (80% profits)
  • Coles Express that operates 711 petrol station convenience stores under an alliance agreement with Viva Energy (10% profits)
  • Coles Liquor, a liquor retailer with 899 stores under the Liquor land, First Choice Liquor and Vintage Cellars brands (10% profits).
Can the business be readily understood?

Yes. Unlike some companies on the ASX, Coles is a business that most Australians will interact with on a weekly basis. It employs around 112,000 Australians. As a retailer they order goods from wholesalers that are delivered to Coles’ distribution centres, these groceries and wine are then delivered to Coles’ supermarkets, convenience and liquor stores, to replace goods sold. Unlike consumer discretionary retailers such as Myer, consumer staples retailers don’t tend to get stuck with goods that have fallen out of fashion. Famously clothing retailer GAP had a downgrade a few years ago after over-estimating the demand for lime green and mustard yellow coloured leather coats.

How does it make money?

Coles is a high volume or revenue business with low-profit margins and a low return on capital. It operates in a mature and highly competitive industry, which primarily reflects the nature of the supermarket industry. In Australia, this industry operates as an oligopoly with significant barriers to entry, mostly based on brand name and an extensive store network. The low return on capital is exacerbated by the significant goodwill and intangible assets recognised on the acquisition of Coles in 2007.

However, it is not all bad news for investors. Coles has a cash conversion ratio of greater than 100%, which is unusual. The cash conversion ratio measures the profits that are being turned into actual cash receipts. Most companies will have a ratio of less than 100%, as companies buy raw materials to convert into finished goods that are subsequently sold. Alternatively, the company will have a percentage of their customers that might be late paying their accounts.

Coles achieves a cash conversion ratio of greater than 100% because suppliers such as Kellogg’s deliver a box of Just Right Cereal to Coles and are paid at a later date, generally between 60 and 120 days. When Coles sells that box of sugary cereal to me for cash within two weeks of delivery, Coles has received cash for selling the box of cereal before they have actually paid for it. Here Kellogg’s have effectively funded Coles’ working capital. This is obviously a positive for shareholders and supports a high dividend payout ratio.

Why is the vendor selling?

The seller’s motivation is one aspect we look at closely when analysing a new company. Historically investors tend to do well where the new company or IPO is a spin-off from a large company exiting a line of business or the vendors are using the proceeds to expand their business. Here Wesfarmers are demerging Coles and are giving their existing shareholders a share in Coles for every share of Wesfarmers they own, and Wesfarmers intend to retain a 15% share in the Coles business.  Under these conditions, Wesfarmers have a strong incentive for Coles to be successful and to provide it with the best start to its life as a new company. Conversely, where the new company is an IPO conducted by private equity owners that are not retaining any ownership, the sellers are incentivised to maximise their exit price rather than the long-term health of the business.

Coles operates in the highly competitive domestic food and liquor business and going forward their growth will essentially track Australian GDP growth. Currently, Coles holds a 33% market share of Australian supermarket spend and 16% of retail alcohol sales. Realistically it would be very hard for Coles to increase their market share meaningfully in either of these categories, without provoking an immediate reaction from competitors Woolworths and Aldi. Fundamentally Coles is a stable, low growth mature business.

Investors more cynical than us might look at remuneration conditions for senior management in the Wesfarmers Annual Report and notice that a large portion of the CEO’s bonus is tied to delivering a high RoC (return on capital). Notably, removing Coles could make it easier to hit those targets. For example, in the last six months, Coles delivered a RoC of 9%, whereas Bunnings Australia (which is remaining with Wesfarmers) had a RoC of 47%!  In the last 12 months, Wesfarmers management has made some pretty significant changes to their business, exiting the UK hardware market, divesting their coal assets and now spinning off Coles.

Is the business profitable?

Yes, over the 2018 financial year Coles had revenues of $39 billion that resulted in a profit of around $1.4 billion. Coles operates in a constrained environment with 30% market share in each of the Australian grocery and liquor markets, which are dominated by large, well-resourced competitors selling the same or similar products sourced from a small pool of manufacturers. Any aggressive moves to grow market share via reducing price would be met quite swiftly by Woolworths and Aldi. Outside of growth in the Australian grocery spend, the main avenue for Coles to increase profits is via cutting costs. Strategies might include improving distribution efficiencies or boosting the number of home brand items on their shelves (while cheaper for consumers these have a higher profit margin for Coles and Woolworths).

However, Coles’ recent 8-week Little Shop campaign of tiny collectable toys based on branded in-store goods (small plastic jars of Vegemite) has been estimated to have generated an additional $200m in sales in the first 2 months of FY2019. This was not a big surprise as the father of an 8-year-old girl who was aggressively pestering adults that she knew to shop at Coles during this period.

Returns to Shareholders

Coles are expecting to pay out between 80-90% of earnings in dividends, which will result in Coles being a high yield, low growth company. Interestingly, whilst Wesfarmers had an excess franking account balance of $978 million as of June 2018, this will remain with Wesfarmers so at birth Coles will start with a no franking credits.   This is not particularly unusual, for example when BHP spun off S32 in 2015, BHP’s franking credits remained with the parent. This approach is often connected with demerger tax relief from the ATO. Tax relief means that Wesfarmers shareholders defer any tax payable until they sell their Coles shares. Given this large franking account balance, we would not be surprised to see Wesfarmers announce a capital return in 2019 in an effort to return this to shareholders.

Financial stability

Coles will be listed with gearing of around 35%. From the demerger documents, Coles will be taking with it a high proportion of Wesfarmers’ debt ($2 billion) relative to the EBIT that it generates, though this is a business with stable cash flows that can handle debt. When we raised this item with management, we were told that the higher percentage of group debt that Coles are assuming reflects the large percentage of capital Wesfarmers have put into Coles over the past decade, which we consider a fair response.

How attractive is the price?

With a price not being set, it is tough to make a judgement as to valuation, other than that the dividend yield is likely to be attractive. We expect Coles will have an enterprise value between $16 billion and $19 billion – making it a top 30 company – and it will trade at a multiple of about 10- or 11-times EBIT and a PE ~ 16x (a 10-20% discount to Woolworths). Back solving for these numbers, Atlas expects that Coles will have a share price between $14 and $15.50.

Risks

Coles faces the potential for store sales to migrate online in the future, fuelled by Amazon – although food and liquor is not an area in which Amazon is focusing in Australia. Coles and Woolworths have both been pre-emptively investing in their online offering to protect their existing business. We note that in much more densely populated Germany, Amazon offers fresh food delivery in only 10 major cities. Conceptually, fresh groceries are less desirable for Amazon in Australia, as many items such a meat, milk and fruit need to be refrigerated. This would necessitate Amazon building separate refrigerated distribution centres in addition to the centres housing books and headphones.

As part of the separation, Coles announced that they would be consolidating five existing distribution centres into two automated sites (one in Sydney and one in Brisbane). This is expected to cost ~$700 million over the next 5 years and will help lower Coles’ operating costs. Automation and consolidation of distribution are designed to allow Coles to compete with Woolworths, Aldi and Amazon.

Our take

Generally, it is hard to forecast how a new company will perform post IPO, as often the market is not that familiar with the new company and its register might be populated by short-term shareholders such as hedge funds that are seeking to make short-term gains. Sometimes (such as in case of the recent spin-off of OneMarket by Westfield) shareholders – including Atlas – aggressively sold their holdings of the spun-off company, because a tech company with no dividend and significant capital requirements was quite different from the parent, a distribution-paying property trust. In the case of Coles, we don’t see this to be an issue, as one of the main reasons for owning Wesfarmers was to gain access to Coles.

 We own Wesfarmers in the Atlas Core Australian Equity Portfolio and will be receiving Coles shares next week. Coles passes our internal quality filter model and we see that exposure to food and liquor offers investors a defensive earnings stream with sustainable comparative advantages in their key markets. We also see that in the medium term, the new Coles could lead to more rational competition in the Australian grocery market and healthier returns for the major participants.

Banks Reporting Season Scorecard 2018

On Monday this week, Westpac ruled off the 2018 financial year-end profit results for the Australian banks. In the words of Queen Elizabeth, 2018 could only be described as an annus horribilis for Australian banks and their investors. In addition to the CEO of one major bank losing his job, the revelations of the Royal Commission on Financial Services resulted in remediation provisions and a spike in legal fees (which should see new sports cars and beach houses at Palm Beach being left by Santa for sections of the legal community this Christmas). Numerous fines have also been levied on financial institutions, and credit growth has slowed. These factors have combined to create an environment of fear that has weighed on bank share prices.

In this piece, we are going to look at the common themes emerging from the banks in the October 2018 reporting season. We will differentiate between the major trading banks and hand out our reporting season awards to the financial intermediaries that grease the wheels of Australian capitalism.


Scaling back the empire

The main theme from 2018 was the banks breaking down the allfinanz model that they have carefully built up over the past 30 years. Allfinanz or bancassurance refers to the business model where one financial organization combines banking, insurance and financial services (such as financial planning) to provide a financial supermarket for their customers. This model is based on the somewhat false assumption that the bank’s employees can efficiently cross-sell different financial products to their existing customers at a lower cost than if this was done by separate financial institutions. Operating in this way obviously creates some of the conflicts of interest that have been on display at the Royal Commission over the past eight months.

Over the past year, we have seen Commonwealth Bank sell their life insurance business to AIA as well as their asset management business a week ago to Mitsubishi UFJ for a very solid price. Similarly, over the past year ANZ have exited both their wealth management and life insurance businesses. NAB also announced plans to sell MLC wealth management by 2019. Additionally, Westpac has continued to reduce its stake in BT Investment Management (now renamed as the Pendal Group). These moves can be seen as acknowledging that the costly exercise of creating vertically integrated financial supermarkets was a mistake. They might also have been motivated by concerns as to what recommendations the Royal Commission is likely to make in 2019.  If adverse rulings are made on vertical integration in the Royal Commission’s Final Report, most of the banks have already made moves to simplify their businesses, so shareholders won’t be exposed to significant “fire sales” of assets by motivated sellers.

Profit growth

Across the sector, profit growth was quite subdued in 2018 as the banks grappled with slowing credit growth, the application of tighter lending standards, customer remediation, and additional legal costs stemming from the Royal Commission. The above Banks Scorecard looks at the growth in cash earnings inclusive of these costs. Whilst many companies encourage investors to look through these charges, ultimately they are real costs that impact the profits available to shareholders. In aggregate the four banks have set aside $1.3 billion to cover customer remediation.

Westpac reported the strongest cash earnings as a result of keeping costs under control, very low bad debts, and a lower level of customer remediation charges. NAB brought up the rear due to both $755 million in restructuring costs and $435 million in customer remediation charges.


Gold Star

Bad debts

A big feature of the 2018 results for the banks has been the ongoing decline in bad debts. Falling bad debts boost bank profitability, as loans are priced assuming that a certain percentage of borrowers will be unable to repay. Additionally, declining bad debt charges year on year create the impression of profit growth even in a situation where a bank writes the same amount of loans at the same margin. Bad debts fell further in 2018, as some previously stressed or non-performing loans were paid off or returned to making interest payments. The principal factors causing this fall have been the low unemployment rate and a near absence of major corporate collapses over the past 12 months.

Westpac and Commonwealth Bank both get the gold stars with very small impairment charges courtesy of their higher weight to housing loans in their loan book. Historically home loans attract the lowest level of defaults.


Gold Stars

Shareholder Returns

Across the sector dividend growth has essentially stopped, with CBA providing the only increase of two cents over 2017. It would be imprudent for the banks to raise dividends in an environment where loan growth is slowing, provisions are rising, and the management teams of the banks are regularly appearing either in front of the Royal Commission or before our political masters in Canberra.

In 2018 dividends were maintained across the banks, which was a surprise in the case of NAB, as we expected a dividend cut. In 2018 NAB paid $1.98 in dividends on diluted cash earnings per share of only $2.02; a very high payout ratio and not a sustainable situation given that the bank’s capital ratio is below the APRA target of 10.5%.

Looking ahead, dividends growth is likely to be subdued in 2019 as the banks digest the outcome from the Royal Commission. ANZ and CBA shareholders can expect capital returns in the form of share buy-backs to offset the dilution from asset sales. In 2018 ANZ have bought back $1.9 billion of their own stock, with an additional $1.1 billion to be bought back over the next six months. The major Australian banks in aggregate are currently sitting on a grossed-up yield (including franking credits) of 9.4%, quite an attractive alternative to term deposits.


Gold Star

Interest Margins

The banks’ net interest margins [(Interest Received – Interest Paid) divided by Average Invested Assets] in aggregate declined in 2018, reflecting higher wholesale funding costs and borrowers switching from interest only (which attracts a higher rate) to principal and interest mortgages. This switching was done in response to regulator concerns about an overheated residential property market and in particular the growth in interest-only loans to property investors. Looking ahead in 2019 margins should recover courtesy of a rate rise of around 0.15% announced in mid-September. In September all the banks put through a similar rate rise with the exception of NAB, and it will be interesting to see whether NAB increases its market share as a result of this or follows suit at a later date.


Gold Star


Total Returns

In 2018 all the banks have delivered negative absolute returns, also trailing the ASX 200 which eked out a small gain of 0.24%. The uncertainty around the outcomes from the Royal Commission, rising compliance costs, and slowing credit growth has weighed on their share prices. Westpac has been the worst performing bank, mainly due to concerns raised earlier in the year about the bank’s lending standards in their $400 billion mortgage book, though we are yet to see any evidence in the form of rising bad debts to back up these claims.

No stars given

Our View

Whilst it is hard to be a bank investor at the moment and some fund managers are advocating avoiding them all together, our view is that at current prices investors are being paid an attractive dividend yield to own solid businesses that have a long history of finding ways to grow earnings and navigate political minefields. Looking at the wider Australian market, the banks look relatively cheap, are well capitalised, and – unlike other income stocks such as Telstra – should have little difficulty in maintaining their high fully franked dividends. Additionally, the share prices of ANZ and the Commonwealth Bank will see the benefit from share buybacks, as the proceeds from the sales of non-core assets are received.  The key bank overweight positions in the Maxim Atlas Core Equity Portfolio are Westpac, ANZ and Macquarie Bank.

IPO Watch: Coronado Global Resources

We are generally pretty sceptical about new IPOs (initial public offerings). Occasionally, however, a great IPO comes along, either for a long-term investment or one with a high probability of making a short-term gain on its opening day, so it is always worthwhile to run the ruler over companies about to list on the ASX.

In this week’s piece we are going to look at the seven key questions we ask when assessing an IPO and apply them to Coronado Global Resources (ASX: CRN). Coronado’s prospectus was one of the largest that I have ever seen – close to 700 pages – perhaps reflecting what is likely to be the biggest IPO in 2018 with an expected market capitalisation of between $3-4 billion.

When analyzing IPOs few have been more eloquent on this subject that Benjamin Graham, the father of Value Investing.

Our recommendation is that all investors should be wary of new issues – which usually mean, simply, that these should be subjected to careful examination and unusually severe tests before they are purchased. There are two reasons for this double caveat. The first is that new issues have special salesmanship behind them, which calls therefore for a special degree of sales resistance. The second is that most new issues are sold under ‘favorable market conditions’ – which means favorable for the sellers and consequently less favorable for the buyer”  (The Intelligent Investor 1949 edition, p.80)

History

Coronado was founded in 2011 by private equity group EMG and since then they have spent US$1.2 billion acquiring 4 producing coal mines located in Queensland, and in Virginia and West Virginia in the US. This places Coronado as the 5th largest metallurgical coal producer globally with annual coal production of around 20 million tonnes (of which 75% is metallurgical coal and 25% thermal coal). In terms of profit, in 2017 60% came from the Curragh coal mine in Queensland and 34% from the Buchanan mine in Virginia.

Can the business be readily understood?

Yes, as a miner Coronado essentially digs coal out of the ground and sells the coal predominately to steel mills in Northern Asia and the US. The thermal coal produced by Coronado is sold to the Stanwell power station in Queensland under a long-term contract.

Whilst coal is a dirty word globally – mainly in conjunction with power generation – 75% of Coronado production is metallurgical or coking coal, which is used in the smelting of iron ore to make steel. This is high-quality coal (commanding a higher price) that low is in ash, sulphur and phosphorous and will burn at a very high temperature (1,300C in a blast furnace). Metallurgical coal is necessary for the production of steel, both as a source of carbon and as a means of heating the iron ore to around 1,300C. By contrast, thermal coal can’t be used in steel production, due to both its high ash content and because it cannot be coked (a process to concentrate the carbon and reduce impurities by heating or cooking the met coal in an airless environment). Globally metallurgical coal is much scarcer that thermal coal and currently trades at twice the price of thermal coal per tonne.

How does the company make money?

Coronado digs the coal out of the ground at a cash cost of ~US$80/t (after royalties) and then sells it to steel mills in the US and Asia. Current prices per tonne of met coal are a little over US$200/t which makes this a profitable exercise.  However, in Australia, Coronado’s product is priced at a discount between 6-16% to the benchmark price due to higher imperfections. Additionally, Coronado is subject to two separate royalty payments from production out of its two biggest mines which will cap profits in the near future. This results in Coronado having weaker profit margins than competitors such as BHP Coal and Whitehaven.

The biggest factors determining the price for metallurgical coal have been spikes in Chinese demand fueled by the construction of new Chinese mills (2006-2010) and pollution controls in China (2016-2018). During these periods Coronado’s coal mines have been very profitable, however, the below chart showing the metallurgical coal price over the past 10 years demonstrates that prices have been quite volatile. Over the past few years, metallurgical coal has risen from US$80/t in early 2016 to around US$200/t, leading to perceptions that the price is vulnerable to a fall if demand for steel weakens. Arguably current high prices above US$200/t for metallurgical coal encouraged Wesfarmers to sell the Curragh mine to Coronado earlier this year for A$700M (or at a multiple of only 1.5 times current annual profit).

Why is the vendor selling?

The motivation behind the IPO is one of the first things to look at. Historically investors tend to do well where the IPO is a spin-off from a large company exiting a line of business, or when the vendors are using the proceeds to expand their business. Coronado is a little bit different from most IPOs – which typically see the vendors seeking to exit as much of their investment as possible – in that post the IPO 80% of the company will be retained by the vendors. This is an unusually high proportion to hold onto, as prospective investor usually likes to see the private equity owners retain a stake in the business on listing between 20-30%.

Whilst the owners floating a company may want to sell out completely, an effect of the 2009 Myer IPO – which saw the department store’s private equity owners sell their entire holding – is that new investors are unlikely to accept a full exit without a substantially lower price (in terms of profit multiples). However, seeing private equity owners retaining an ownership stake after the float is no guarantee that the IPO will be a sure-fire winner; the vendors of Dick Smith retained a 20% stake on the listing which was sold down 9 months later. Within three years of the float, Dick Smith went into administration.

The issue with an 80% stake being held by EMG is that the market will perceive this to be an overhang that may depress the CRN share price following listing. This 80% stake is subject to voluntary escrow. Coronado’s owners expect to raise around A$774 million. Of this around $600M will be used to repay debt and pay the costs of the IPO with the sellers banking around $110 million.

Is the business profitable?

Yes: rising coal prices in 2017 saw Coronado’s net profit after tax move from -US$9 million loss to US$282 million profit in 2017 with a similar amount expected in 2018, before a big jump to US$400 million in 2019. However, this is very dependent on the coal price; for instance, a 10% change in the coal price would move 2019 EBITDA by either plus or minus US$200 million. The coal price is highly volatile, despite current very high prices, driven by expansion in the Chinese steel-making industry and demands for high-quality Australian coal over lower quality domestic Chinese coal to reduce pollution. During 2011-2016 the coal price fell dramatically, which saw Coronado’s US mines move to break-even at the EBITDA line (Earnings before interest tax depreciation and amortisation) and the glitzy Curragh mine’s EBITDA decline to US$61 million (2018 EBITDA $360 Million).

Financial stability?

Coronado is expected to have net debt of only around 0.5x EBITDA in 2019, which will equate to an interesting cover of around 14x – two very strong debt metrics. This reflects a $500M reduction in debt as part of the IPO. However, we see that this is a business that cannot handle too much debt, due to the volatility in pricing of its product, of which Coronado is a price taker.

How attractive is the price?

A decision to invest in Coronado should be based on your outlook for met coal prices. If current prices are maintained Coronado will trade on an EV/EBITDA multiple of around 4x, and based on the company’s stated pay-out ratio of 100% free cash flow this results in a dividend yield between 10-12%!  Whilst this looks sensational, there are questions about its sustainability. Comparable coal stock Whitehaven Coal is currently trading on 5x EV/EBITDA multiple and a 6% yield with no debt. Globally coal companies are trading on an EV/EBITDA multiple of 4.5x, a very cheap multiple that indicates that the market does not believe that current high prices for coal will be sustained.

Our take

Using a conservative coal price of around US$150/t, our modelling indicates that Coronado’s free cash flow will drop from around $400M today to around $180M, which would place Coronado on a yield of 5%, i.e. solid but unspectacular.

Whilst we are comforted by vendor EMG retaining an 80% holding, we are concerned about buying into a recently put together company trading at peak earnings, especially when the previous owners of major assets that make up Coronado’s portfolio were happy to sell at lower prices.

We will be passing up Coronado due to this concern and our inability to predict the metallurgical coal price in the near future.  Additionally, with the last line of Ben Graham’s quote from above on IPO’s in mind, given the movement in the coal price over the past few years, it is hard not to take the view that October 2018 may represent a very favourable time for Coronado’s owners to be selling shares to Australian investors.

CBA: Much, much better than expected

Normally the semi-annual profit results from the Commonwealth Bank are fairly staid affairs, with the bank delivering consistent profits with few surprises. However, this reporting season the CBA result will face a far greater degree of scrutiny after the annus horribilis of 2018.

In this period, the bank has faced 9 challenges:

1) Royal Commission

2) CEO resignation

3) CFO resignation

4) Settlement with AUSTRAC for $700 million

5) Demerging Colonial Wealth Management

6) APRA Inquiry

7) Sale of life insurance business,

8) settlement of interest-rate rigging case with ASIC and

9) A weak 3rd quarter update in May.

When companies confront the range of issues that CBA has faced over the past 12 months, new management teams often have the opportunity to rebase earnings downwards, thus giving themselves easier hurdles to jump over in the future.

The market was quite pessimistic on CBA going into this result and so has been surprised at the +3.7% increase in cash profits and that the dividend was slightly increased.

The 2018 result also showed that the bank had increased their net interest margin [(Interest Received – Interest Paid) divided by Average Invested Assets] from 2.1% to 2.15%. Whilst this does not sound like much, small changes in this margin are beneficial when applied to an asset base of $975 billion.

The expansion in this margin shows that over the past year CBA has been successful in both raising prices on their loans and reducing the interest rates paid to those that lend the bank money such as depositors.

A significant feature in the profit growth that the major Australian banks have enjoyed over the past five years has been declining bad debt charges. Consequently, one of the key financial indicators to look at is a banks’ bad debt charge, as a rise in this charge is likely to indicate the start of a cycle of rising bad debts as these charges normalise to a long-term average of around 0.3% of gross loans. This result showed that CBA’s impairment charge actually fell further to 0.13% over the past six months.

Result was better than we expected

2018 has been a tough year for investors in bank stocks and in particular for CBA shareholders. The prevailing narrative has been a negative one dominated by concerns about the Royal Commission, house prices and exciting fintech companies displacing the banks.

We added to the CBA weight during the Royal Commission and going into the result, as we saw that the market price discounted both the resilience of the CBA’s key profit centre retail banking services and management’s ability to respond to the changing environment.

Our positive investment view towards Australia’s premier retail bank has not changed, though in fairness this result was better than we expected.

What the market was underestimating

Going into this result the market has been overlooking CBA’s ability to pull various levers to maintain profits in response to changing market conditions.

Going into this result the market was expecting contractions in the bank’s net interest margin, due to rising funding costs as measured by the BBSW (bank bill swap rate) and the impact of 2017’s big bank levy.

The below table shows the levers pulled by management to maintain profits, namely raising rates on loans and controlling the rates that the bank pays for retail deposits.

This post originally appeared in Livewire

Big versus Small Company Investing

Over the past twelve months, small companies (as measured by the ASX’s Small Ordinaries) have returned 22%, outperforming large caps (ASX Top 100) by almost 10%. This has led to numerous articles in the financial press claiming that small is beautiful and that investors should look beyond large Australian companies to add growth and excitement to their portfolios.

In this week’s piece, we are going to look at the reasons behind this performance discrepancy on the ASX, and why investors tend to get compensated for investing in small capitalisation companies.

Large capitalisation companies are defined as those in the Top 100 companies listed on the ASX. They tend to be large household names such as NAB, Woolworths or Harvey Norman. Currently the smallest large-cap company – measured by market capitalisation (shares outstanding multiplied by price) – is CSR with a market capitalisation of $2.1 billion which has been listed on the ASX since 1962. Conversely, companies classified as small caps are generally newer companies seeking to grow earnings by developing a new mine, product or technology. An example is Afterpay Touch that was first listed last June. Often small companies grow at such a rate that they become classified as large companies like A2M Milk. However, this also works in the other direction in the case of declining companies like Myer.

Life is harder for smaller companies

At first glance, one would think that smaller companies on average should underperform large companies, as company size confers stability and a range of advantages. In other words, small companies have limited financial resources and fewer avenues to access the capital markets. These characteristics entail commercial disadvantages, for example, Westpac can easily raise capital from a number of sources quickly, whereas a small company may only be able to tap existing shareholders. Additionally, small companies generally face a higher cost of debt with a shorter tenor, as only large companies are able to sell 10-year bonds to the US Private Placement market. Larger companies can therefore negotiate more forcefully over interest rates with the domestic banks.

Additionally, smaller companies often have weaker competitive advantages than many large Australian companies that operate in cosy domestic oligopolies, where the incentive is mainly to maximise profits by managing the political environment to maintain the status quo. Arguably however the competitive advantages conferred by operating in domestic oligopolies can lead to destructive offshore acquisitions designed to deliver growth that may be elusive domestically, where the company is constrained by regulation or the actions of competitors protecting their market share. A recent example of this can be seen in Wesfarmers’ hardware acquisition in the UK and BHP’s foray into US shale gas.

Small companies outperform

Despite these challenges, since the 1980s a number of studies have shown that small-cap equities have historically outperformed large-cap equities on a risk-adjusted basis over the longer term. The most famous study of this phenomenon was done by Nobel laureates Fama and French[1] who looked at monthly returns between July 1926 and February 2012 in the US stock market. They found that during that time, small-cap stocks also delivered a cumulative excess return of 253% relative to large-company stocks. In their view, the outperformance of small caps over large caps was due to an element of risk unique to small companies; that is, investors are compensated for undertaking additional risk inherent to investing in companies with higher risk

As a former small-cap fund manager, my observation is that some of this outperformance can also be attributed to market inefficiency and not just compensation for additional risk. Inevitably smaller companies are less well understood by the overall market. They will be less subject to analyst coverage from the investment banks, which could increase the risk of mispricing. For example, there are 16 analysts working at large investment banks publishing research on BHP, all seeking to uncover new information or angles on this company currently worth $112 billion. Conversely, most small companies struggle to receive minimal – if any – coverage from stockbrokers.

The last twelve months in Australia

Over the last twelve months, small capitalisation companies listed on the ASX have outperformed their larger cousins by close to 10% on average, a significant gap. The largest 100 companies on the ASX have returned 13% including dividends, a pretty good return by historical standards. However, amongst these companies there is a significant variance in returns.

Amongst the large caps the top performing companies were CSL (56%), Santos (+88%), ResMed (+59%), and Macquarie (+48%), ably assisted by mining heavyweights BHP (+39%) and Rio (+25%).  Whilst these are all great returns for investors the average return has been dragged down by Telstra (-26%), AMP (-29%), and Fortescue (-19%) as well as fallen angels Ramsay (-18%) and Harvey Norman (-15%). However, the real story behind the underperformance of large capitalisation stocks is the banking sector that has essentially done nothing over the past year: Westpac (-2%), NAB (0%), ANZ (+3%) and CBA (-7%). These four stocks represent close to a quarter of the ASX – though if we measured this four weeks ago the results would have been worse!

Whilst the returns over the last year from large companies such as CSL and Santos were impressive, they look quite pedestrian when compared with the star small-cap companies such as Afterpay Touch (+361%), Beach Energy (+186%), Appen (+161%), WiseTech Global (+113%), and A2M milk (+130%). The common theme amongst these is investors paying for early-stage IT or growth companies that benefit from leveraging exciting technologies or are M&A candidates for bigger companies.

The small cap index also has a large weighting to mining services and small mining companies that were on their knees in early 2016 but given their operating leverage have benefited from rising commodity prices in 2017 and 2018 courtesy of a Chinese stimulus plan. Still, investing in small companies is not without risks, as when things go wrong for a smaller company often the consequences are more extreme than for a larger more established company. Over the past year Retail Food Group (-89%), BlueSky (-74%), Isentia (-55%) and Myer (-32%) have caused a degree of pain for small cap investors, as well as former market darlings Ainsworth Game Tech (-53%), Vocus (-29%), Class Super (-26%) and Amaysim (-41%).

The last ten years

Over the past 10 years the large caps have actually outperformed the small caps by 30%, however we recognise that a big factor in this performance is related to the time frame used. As you can see from the below chart, the market crash during the GFC hit the smaller companies much harder than their larger cousins, with the small companies falling on average -48% in 2008 compared with the still very painful -29% fall for the Top 100 companies. When the economy falters, smaller companies have a greater risk of going into administration. Given the number of small companies listed on the ASX exposed to mining or mining services, share price falls are magnified when the downturn in the economy is accompanied by a fall in commodity prices as it was in 2008.

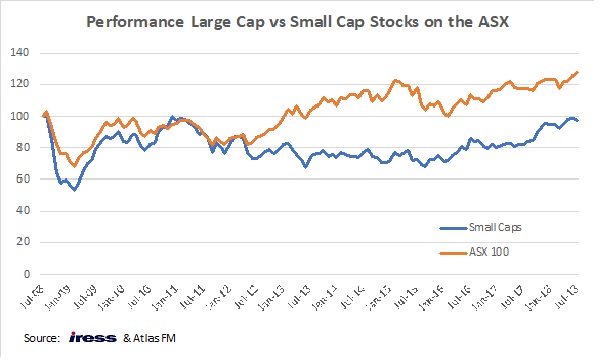
Additionally, after a recovery in 2009, the above chart shows that the small capitalisation index was unchanged until early 2017. Over this same period the large caps did well, particularly in the period 2012 -2015. This occurred as the large cap financials benefited from the removal of competition and falling rates globally, whilst the mining stocks bounced back courtesy of higher commodity prices from a range of Chinese stimulus plans.

[1] Fama, Eugene F & French, Kenneth R, 1992. ” The Cross-Section of Expected Stock Returns,” Journal of Finance, American Finance Association, vol. 47(2), pages 427-465, June.


Our Take

Since March 2009, the ASX has risen close to 60% and in our opinion, there is a range of companies on the ASX that are priced on the assumption that benign conditions will continue indefinitely. Towards the latter stages of any sustained bull market in equities, it is prudent for investors to have a close look at what they have in their portfolio. We would be disinclined to own small cap companies that rely on benign debt and equity markets to finance their growth or are “concept stocks” still proving up their business model. Whilst many of the larger companies might not have the “blue sky” growth prospects of some of the stellar small caps of the past year mentioned above, they do however have business models that have been tested during trying market conditions. With the ASX small companies index trading on 21x forward earnings one could think that you are paying quite a lot for this growth with a minimal margin of safety.