

Move over WAAAX. Dividend payers will be new growth stars
He suggested the growth in the so-called WAAAX stocks (WiseTech Global, Appen, Afterpay Touch, Altium and Xero) would begin to slow, with their valuations driven largely by a fear of missing out rather than by underlying fundamentals. “While the WAAAX companies have interesting products, the market is pricing nothing but blue skies ahead,” he said.
Category: Uncategorized
SMH: Westpac risks second strike on executive pay
May Monthly Newsletter Atlas High Income Property Fund
- The S&P/ASX 200 A-REIT index had a strong month in May gaining +2.4% powered by the developers which posted strong gains after a surprise coalition victory. With trusts such as Goodman and Charter Hall now being valued at over 25 times forward earnings and distribution yields between 2-3%, the market is pricing these trusts as if we were in the early days of a property boom, rather than in one that is unwinding.
- The Atlas High Income Property Fund declined by -0.7% in May due to weakness in the share prices of the consumer staples landlords, as well as last month’s star performer Unibal-Rodamco-Westfield trading downwards in line with global equity markets.
- We remain very frustrated by the Fund’s performance relative to the property index that is being increasingly dominated by developers and fund managers, rather than traditional rent-collecting property trusts. Atlas strongly believe that a portfolio populated with trusts that offer investors recurring earnings from rental income, will outperform through the cycle and allow us to deliver a more stable stream of distributions to the Fund’s investors.
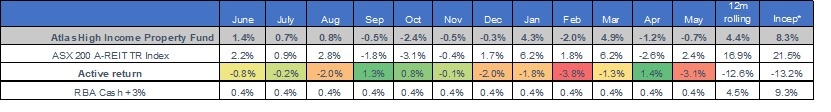
Go to Monthly Newsletters for a more detailed discussion of the listed property market and the fund’s strategy going into 2019.
Crown Resorts (CWN) with Hugh Dive form Atlas Funds Management

Late on Friday morning, 31st May 2019, Crown’s largest shareholder, James Packer, announced that he had sold half of his stake in CWN for $1.8 billion to former Macao casino partner Lawrence Ho. Ho’s purchase works out at $13 per share for 19.9% of the company. Dive puts Crown through the Quality Filter Model (QFM) to see how the risks outweigh the benefits of investing in CWN.
This year’s most (and least) profitable companies
In May 2018 I wrote an article titled The most (and the least) profitable companies on the ASX200. The article was written in response to reading several pieces in the financial press, breathlessly describing the size of profits that the major banks had generated which created the impression that they were very profitable companies to own. Recently, Livewire got in touch and asked me to provide an update on that article.
While the absolute dollar value of profits the banks made in 2017 was large (around $15 billion), when divided by the number of shares outstanding, the earnings per share was not that impressive. Additionally, when compared to other listed companies, the bank’s profit margins and return on capital was not very impressive.
In looking back at the article written twelve months ago, I am going to both
In the 2018 piece on profits, we suggested that growth in earnings per share, Return on Capital Employed (ROCE) and change in profit margins were a better indicator than some absolute profit figure of how efficient a company’s management team is in generating their annual profits. Over the past year all of these profit metrics have turned south for Australia’s banks due to a combination of slowing demand for credit and remediation and compliance costs stemming from the 2018 Royal Commission.
Return on capital employed (ROCE) – what are currently the companies with best ROCE metrics? And what is the worst?
Return on Capital Employed (ROCE) looks at the profit generated both by the capital that the equity holders have contributed to establish the business, as well as the debt taken on to support the business’ activities. Companies with high ROCE typically require little in the way of equity to keep the business running and little need to borrow from their bankers.
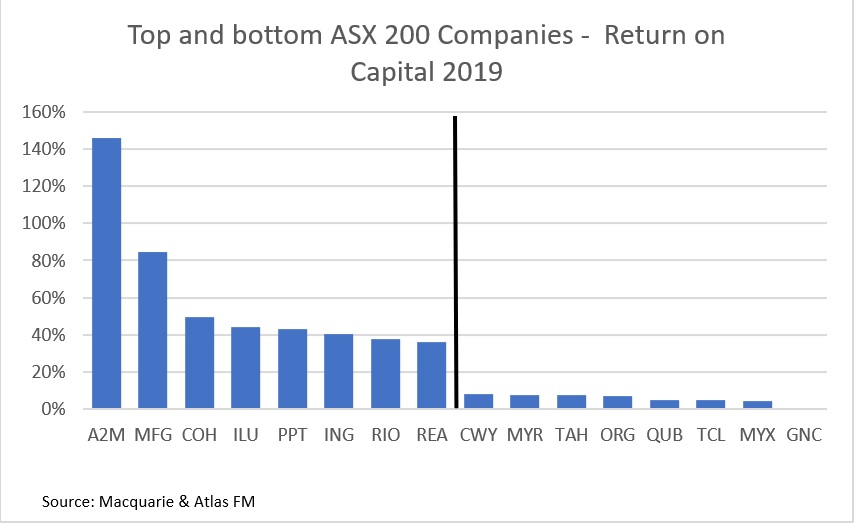
The list of the top performers is largely unchanged over the past 12 months, with milk company A2M leading the pack, which includes fund managers Magellan and Perpetual as well as medical device company Cochlear. New additions for 2019 are the miners Iluka and Rio Tinto, courtesy of surging commodity prices. However miners typically appear only occasionally on the list of the top companies on this measure due to the vast amounts of capital required by mining operations.
Similarly, the list of the bottom performers in terms of return on capital employed is similar to that from 2018 comprising businesses that require both large amounts of initial capital to start the business and regular capital expenditure to maintain the quality of their assets and finance their ongoing activities. This subset includes a logistics company (Qube), retailer (Myer), toll road owner (Transurban) and an energy company (Origin). Grain handler GrainCorp and generic drug manufacturer Mayne Pharma make this list due to falling profits, though GrainCorp also has a substantial capital base.
Profit margins – what companies generate the best margins? And which present poor margins?
Profit margin is calculated by dividing after-tax profits by revenues. It measures the percentage of each dollar received by a company that results in profit to shareholders. Typically, low margin businesses operate in highly competitive mature industries or in industries such as retail and construction where the revenues can be large, and the company is only looking to make a small profit on each dollar of revenue.
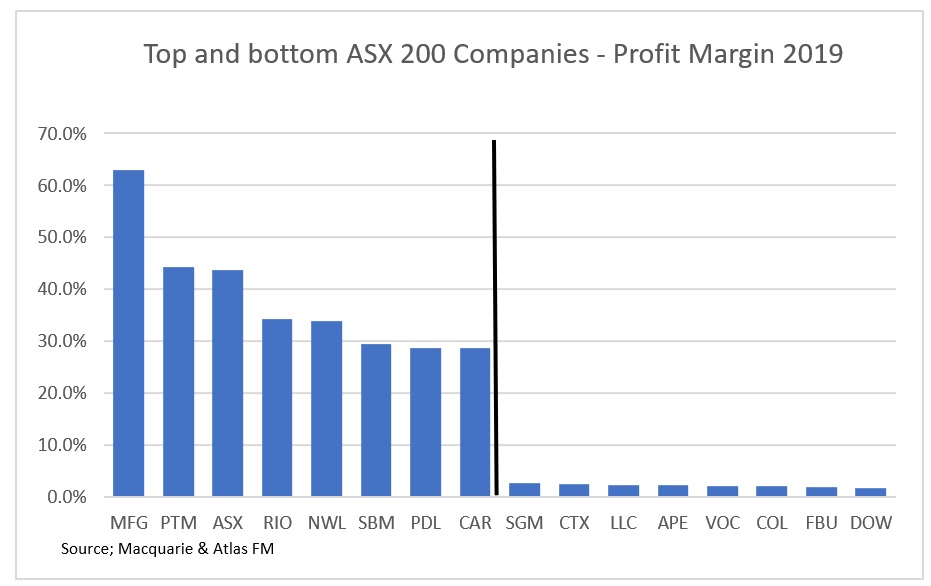
The list of the top performers is similar to that from 2018, headed by diversified financials Magellan, Perpetual, ASX, Netwealth and Pendal. The dominance of financial companies and in particular, fund managers on the list of companies ranked by profit margin is due to the operating leverage that a fund manager enjoys once a certain amount of funds covers their fixed costs. After a certain level of funds under management, a significant percentage of each additional dollar of revenue from asset-based fees becomes profit for a fund manager.
The emergence of miners such as Rio Tinto on 2019’s list of companies ranked by profit margins is due to the surge in commodity prices, in particular, iron ore. In Rio Tinto’s case, it is very profitable to sell a tonne of iron ore at US$100/tonne when the cash cost to extract this tonne is around US$14.
Low-profit margin companies characteristically receive large revenues but operate in intensely competitive industries such as petrol retailing (Caltex), grocery retailing (Coles), department store (Myer), telecommunications (Vocus) and construction (Lend Lease and Fletcher Building). Companies with low-profit margins have to keep a very close eye on changes to their profit margins as a 1% change to Myer’s profit margin could have a fatal impact on their business, whereas a 5% change in Magellan’s profit margin may see minimal changes at the global fund manager.
How did 2018’s crop fare?
Over the past 12 months, the average return for the top and bottom companies as measured by ROCE in May 2018 was around 15% – close to 3% above the ASX200. The bottom performers were dragged up by a solid performance from Myer (+51%), Santos (26%) and Qube (+25%). In the top-ranked companies in 2018 by ROCE a2M Milk (+50%) and Magellan (+95%) were dragged down by Flight Centre (-27%) and Pendal (-17%).
Over the past 12 months, the average return for the companies with the highest profit margins in May 2018 was stellar +21%, close to double the ASX 200’s return of 12% and ahead of those companies with the lowest profit margins that returned a surprising 11%. In the high-profit margin companies from May 2018 Magellan (+96%), BHP (+25%) and the ASX (+31%) continued to climb. The low-profit margin companies generally recorded pedestrian performance, though the average was dragged up by a successful spin-off from Wesfarmers (+24%) and bettering very low expectations from Myer (51%).
What companies have both great ROCE and profit margins? And which should investors avoid?
Companies with very strong returns on capital also tend to enjoy solid profit margins, indicating that the company has a franchise or a moat that reduces the impact of competition and allows it to charge a premium price for its product. For example, Cochlear’s hearing implants, REA’s dominance in online real estate sales and a2 Milk’s more easily digestible dairy products.
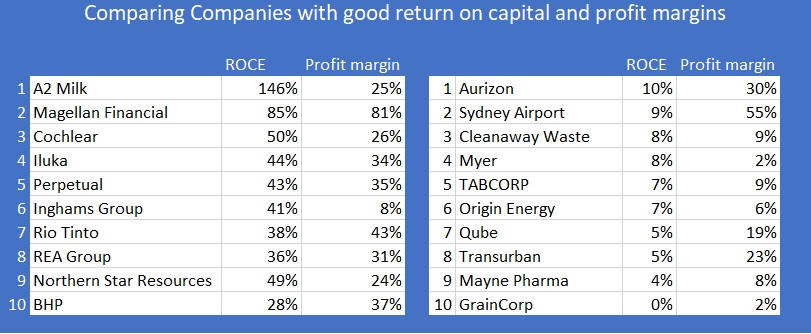
Conversely, a number of the low return on capital companies also have low-profit margins, something that reflects the intense competition and lack of pricing power in areas such as retail (Myer), energy (Origin) and generic pharmaceuticals (Mayne Pharma). However, from the above table on the right, you can see that several infrastructure companies stand out as having a low return on capital companies but high-profit margins. This occurs as a toll road concession or an airport have a very large upfront capital cost, but the ongoing costs to manage these assets and collect revenue is quite low.
This piece originally was published by Livewire Markets: This year’s most (and least) profitable companies
Our Take
When buying a business or indeed a share of a business that is traded ASX, the ideal company to own is one that has high returns on capital, has a sustainable competitive advantage, low to no debt and generates capital internally to grow the business. In constructing our portfolios, we deliberately avoid companies with low returns on capital and low-profit margins. These two factors tend to offer little in the way of a “margin for error” and often result in dilutive equity raisings from shareholders to steady the ship when business conditions change for the worse. Historical companies with these double negative characteristics included Gunns and Arrium, both of which ended up in administration after several painful capital raisings.