

CBA boss defends stock plunge after record $10b cash profit – News.com.au

For equity analysts and fund managers in Australia, Christmas comes twice a year, every February and August, when most Australian listed companies reveal their semi-annual profit results. Companies also guide what growth in profit, revenue, profit margins or dividends that shareholders can expect over the following financial year.
When companies miss market expectations for earnings, a guide to a bleaker future the day can be very unpleasant. Alternatively, it can be enjoyable when the company reports a result that validates the investment case for including the stock in the portfolio.
In this piece, we will explore how Atlas approaches each day during the reporting season and what typically occurs during a typical day during the August earnings season that kicks off next week.
Before Reporting Season
In the lead-up to reporting season, Atlas reviews all the stocks in the portfolio and considers the key factors and financial metrics that investors will be looking for on results day. We compare our forecasts to the consensus analyst forecasts. What we are trying to do here is to identify which companies are performing ahead of expectations and, more importantly, which companies have the potential to disappoint. For example, in June, we trimmed our positions in Wesfarmers and Commonwealth Bank (again) based on our view that their share price movements in 2025 were excessive compared to our expectations for their upcoming financial results.
Atlas expects Australia’s largest bank to deliver growth in earnings per share for FY2025 of around 4%, which seems relatively modest, considering the company is trading on 29 times forward earnings and whose growth is largely linked to Australian GDP growth. Similarly, while Wesfarmers is arguably the nation’s top retailer, the expected 1% earnings growth does not mesh with a company trading on 36 times forward earnings.
In the case of the large mining and energy companies, investors have fewer surprises on results day. This occurs as these companies release a production report in mid-July detailing the tonnes of iron ore or LNG produced, along with the average price received. This allows investors to back-solve for expected profits based on assumed production costs. In July 2025, the production reports were mostly benign except for the gold companies, some of which revealed production issues.
Confessions
The months leading up to the start of each reporting season are known as “Confession Season”, specifically from late May to mid-July, as companies become aware that they will not meet profit expectations and then “confess” their shortcomings. When business conditions are occasionally stronger than expected, the company will upgrade guidance before results day.
The Corporations Act imposes continuous disclosure obligations on listed companies, which require companies to keep the market informed of any market-sensitive information that would materially impact the company’s share price. This is done to maintain market integrity and prevent some traders from using inside information on a company to the detriment of others, such as knowledge that a company’s earnings will be below expectations. For example, in June, Domino’s Pizza, IDP Education and Reece all announced that their earnings for the past six months would be substantially weaker than expected.
When a company has already revealed its unexpectedly poor results before the reporting season, the focus on results day is not on the actual profit numbers but on a detailed explanation of what caused the issue and the management’s plan to address it. This often sees a rebound in the company’s share price when the “facts” are more benign than the “fears”. A retailer of car parts falls into this category for Atlas, and we look forward to having a robust discussion with management immediately after the results are released in late August.
The Spread over the Month
Companies listed on the ASX with a June year-end have until the last day of August to release their financial results; otherwise, they are suspended from trading on September 1st. However, results are not released evenly throughout the month, as companies tend to avoid reporting in the first weeks of the month, preferring instead to release them in the middle and last weeks. Consequently, there are days when several large companies report on the same day and often at the same time, which often results in the market making swift and poorly considered decisions about whether the results are good or bad. Frequently, we see a stock trading down on what Atlas considered to be a favourable result, only to see the company’s share price recover the following day after investors have digested the financial reports. This trend has been exacerbated by the impact of high trading “bots” in the market, utilised by high-frequency trading firms that are mostly influenced by momentum algorithms. A factor not imagined during my first reporting season in Canada over a quarter of a century ago.
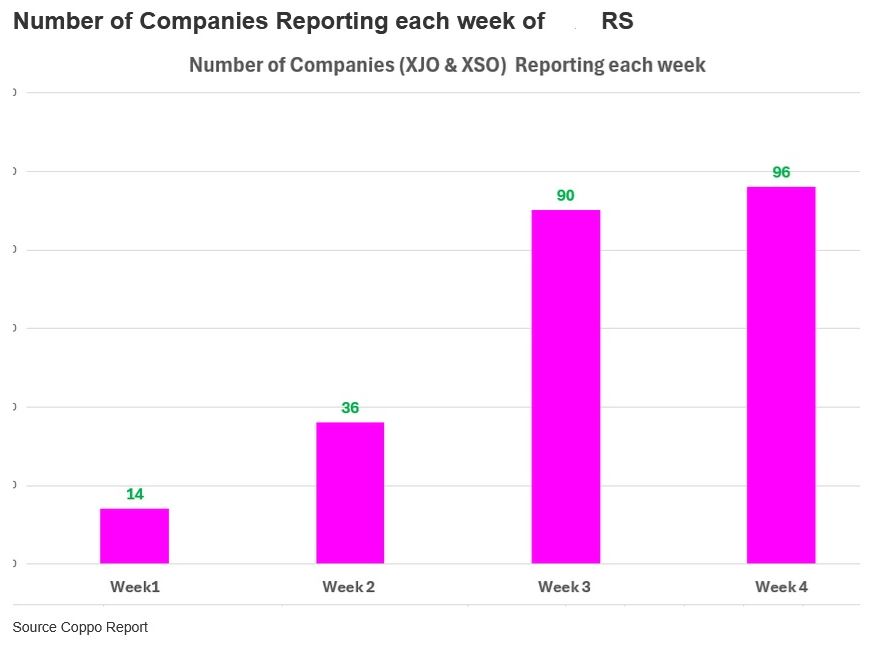
The chart below shows the distribution of results during the upcoming reporting season, with the week starting August 19th being the heaviest. Tuesday, August 19th, will be challenging for many investors, with BHP, Reliance, CSL, Challenger, Hub24, Region, Sims Metals, and Woodside all reporting.
On a busy day with multiple companies reporting simultaneously, we will skim through the results and look at the initial price movement at the market open to guide which companies to prioritise. The focus will then shift to those companies whose share prices are falling, either to understand the flaw in our investment thesis or to see whether the weakness is temporary and could represent a buying opportunity.
On the Day
Generally, companies post their financial results with the ASX around 9 am; this gives investors an hour to digest the facts and figures before trading on the stock exchange begins at 10 am.
During this period, we will review the profit and loss, balance sheet, and cash flow statements, comparing our forecasts to what the company actually delivered. Additionally, it is crucial to compare a company’s performance against its competitors. For example, in isolation, JB Hi-Fi or Coles reporting a slight decline in sales and a steady profit margin could signal a great result if Woolworths or Harvey Norman reported significant decreases in sales and shrinking profit margins earlier in the week. A better result than competitors indicates superior operational performance and a market share gain.
Company management will then formally present their results to shareholders on a conference call or in person during the morning, generally between 10:30 am and midday. Occasionally, we see similar companies give presentations at the same time, which leads to questions to their investor relations teams about coordinating calendars.
These presentations are directed towards the institutional investment community and are generally closed to the media and public. They can take 45 minutes to two hours, depending on the company’s complexity, the analyst’s interest, or the negative result that requires management explanation. Before the COVID-19 pandemic in 2020, these events were held in person at a hotel auditorium or the company’s offices, which allowed for some discussion with the management team afterwards. However, in 2025, most companies (except a few financial companies) will host the presentation online. Institutional investors appreciate this change as there are often days when several companies report, some at the same time.
During the call, the management team details the factors contributing to the profit result and explains any potentially contentious issues. The most informative part is always the question-and-answer session, which allows investors to gauge management’s confidence in addressing the most controversial issues from their financial accounts.
Typically, it will only be the sell-side analysts asking management questions, with the large institutional investors saving their questions for behind closed doors. The problem with this is that, in addition to writing research, some sell-side analysts want to protect their relationship with the company and maintain a good relationship for future lucrative investment banking deals. Maintaining a good relationship with company management has become increasingly important, as investment banking deals, such as capital or debt raises, are far more profitable than the meagre brokerage fees paid to buy and sell shares. Consequently, a sell-side analyst has fewer incentives to skewer a management team or institute a sell call on a company. Frustratingly, this can sometimes result in soft questions being served up for management or avoiding the hard questions when management has made mistakes.
After presenting the results, Atlas will typically have a brief discussion to assess whether there have been any significant changes to our thoughts and to discuss the market reaction. The immediate market reaction can often be misleading, as most trading on results day is conducted by hedge funds or high-frequency algorithmic trading, which is driven by computers rather than long-term, fundamental investors.
Immediately Afterwards
Over the following week, the company will organise individual one-hour meetings with their largest institutional shareholders in Australia and overseas. Before these meetings, it is essential to be well-prepared, as this is frequently the best forum to determine whether you should buy more of a company’s stock or completely sell out.
During our meetings with the management teams, we will generally seek clarity (on behalf of our investors) on specific issues that we feel weren’t covered to our satisfaction at the formal presentation. While some of these meetings can be quite hostile or very friendly, they are a valuable forum for both parties to give feedback on how our client’s capital has been managed in the past and how that capital should be employed in the future.
After the management meetings and reviewing the financial results of a company’s competitors, Atlas is then in a position to determine what changes (if any) are made to our valuation of the company and whether the results have changed our investment thesis for owning the company. We will also look at the key themes emerging from the reporting season. For August 2025, this is likely to revolve around the health of the economy and the impact (if any) of Trump tariffs.