

Coles is hammering Woolworths. But is it a better buy for investors?
It’s a tale of two supermarkets: Coles’ share price is up by 25 per cent, while Woolies has lost almost a fifth of its value. But which one offers the better future upside?
Category: Uncategorized
A ‘brutal’ ASX reporting season – winners, losers, and what’s next – NAB trade
Australia’s ANZ to cut 3,500 jobs as new CEO Matos takes charge – Reuters
August 2025 – Reporting Season Wrap
During February and August, most Australian listed companies reveal their profit results and guide how they expect their businesses to perform in the upcoming year. Whilst we regularly meet with companies between reporting periods to gauge how the businesses are performing, companies open up their books during reporting season to allow investors a detailed look at the company’s financials. As company management has been in “blackout” (and prevented from speaking with investors) since mid-June, share prices in the six weeks leading up to the result are often influenced by rumours, theories and macroeconomic fears rather than actual financials.
The August 2025 company reporting period, which concluded last Friday, showed that most Australian companies were in better shape than expected, especially those exposed to the domestic rather than international economies.
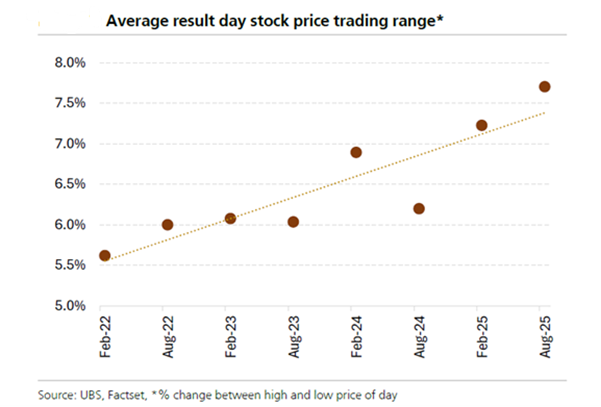
The dominant themes of the August reporting season were increased volatility and extreme share price moves on reporting day (both positive and negative), with the average intra-day share price move on the day of the results close to 8%! In general, the banks remain strong, with interest rate cuts to support consumer spending and weaker housing markets in Australia and the United States. In this week’s piece, we examine the key themes from the reporting season that concluded last week, along with the best and worst results, and how the Atlas Portfolio performed.
Increased Volatility
The defining feature of the August 2025 reporting season was the heightened volatility on results day, which UBS has demonstrated in the table below has been steadily increasing. Further, this intra-day volatility was not confined to struggling small caps reporting unexpected losses; in August, we saw substantial moves in the share prices from blue-chip companies such as CSL, Woolworths, James Hardie and Wise Tech after releasing results that were below market expectations. In looking for reasons behind this volatility, some have pointed to the high level of the ASX 200, which is at an all-time high. If this were true, we would expect only one-way traffic on the downside; however, several companies saw their share prices jump markedly after reporting results slightly better than expected, namely Coles, Westpac, and Stockland. According to an Atlas view, a significant component of the higher volatility in the reporting season is attributed to the influence of high-frequency trading funds (HFT) and the increased prevalence of trading strategies utilising AI to trade based on the tone of the results day calls. For example, JB Hi-Fi fell 8% on results day after reporting a solid result, and then the share price recovered the following day to finish +7% for the month.
Banks continue to Shine
As we have seen over the last few reporting seasons, the banks continue to remain well-positioned within the Australian economy, with the Commonwealth Bank providing its annual results and the other banks providing quarterly trading updates. Across the updates, deposit competition appears to be falling, with Westpac and NAB increasing their Net Interest Margin (NIM) over the quarter, while CBA’s NIM remains steady over the half. In combination with lower expense growth, all of the banks were able to increase their profits over the period. Another consistent theme from the banks was extremely low bad debts, with CBA reporting 0.07% impaired loans, which are likely to benefit over the short to medium term as interest rates look likely to fall further.
Consumer Spending strong assisted by rate cuts.
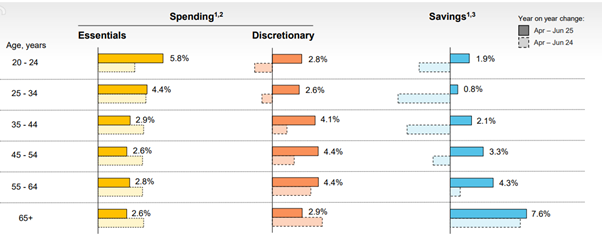
Before the reporting season, one thing that was not fully understood was how much the three interest rate cuts the Reserve Bank made during the year would boost consumer spending. The data from the reporting season suggests that pressure on households is easing, and consumers are continuing to spend on discretionary items. However, consumers are not willing to open their wallets to all companies to the same level.
Electronics retailers JB Hi-Fi and Harvey Norman both increased revenue by 10% and 4% respectively, driven by the uptake of new AI-enhanced electronic offerings. Both retailers outlined how the demand for AI products and the need for cutting-edge technology across connected home systems (smart washing machines, smart fridges and smart furniture) have captured the interest of many consumers.
The big supermarkets Coles and Woolworths showed that consumers continue to spend more on groceries, with each of them reporting a revenue increase of 4% and 3%, respectively. This stronger spending appears likely to continue, with Coles’ revenue increasing by 5% in the first eight weeks of FY26 and Woolworths’ revenue increasing by 2% over the same period. However, consumers appear to be pulling back on spending on alcohol, with Coles Liquor showing only a 1% increase in revenue over the period and Endeavour’s Dan Murphy’s sales remaining stable throughout the year.
Notably, the trading outlook for the first six weeks of the 2025 financial year showed that the three interest rate cuts have energised retail sales. Many retailers, including Adairs (+23%), Universal Stores (+17%), Nick Scali (+7%), and JB Hi-Fi (+5%), have all posted strong sales growth post Jun-30.
Show me the money
A large focus for the August 2025 reporting season was how companies allocated capital management and how best to utilise it within the company before returning future earnings back to shareholders. Companies that earned franking credits saw most of them distributed back to shareholders, with some companies announcing special dividends (JB Hi-Fi and Wesfarmers) that will also be fully franked when paid to shareholders. Whilst only nine companies in the ASX 200 announced on-market share buybacks, the size of these buybacks was quite large, with Telstra announcing a $1 billion buyback, CSL announcing a $750 million buyback, Suncorp announcing a $400 million buyback, and Brambles announcing a $400 million buyback.
Across the ASX Top 20 stocks that reported (excluding the major banks, which have different financial year-ends), the weighted average increase in dividends was 2.4%. On the positive side of the ledger, Wesfarmers, Northern Star and QBE Insurance offset dividend cuts from BHP, Woodside, Fortescue and Woolworths, across the wider ASX 200, corporate dividends declined by -2%.
Best and Worst Performers
Over the month, Charter Hall, Seek Limited, Ampol, Life 360 and Coles delivered the best results. Despite looming tariffs and economic uncertainties, these companies were able to increase revenues and prices (Seek and Life 360), grow their businesses through mergers and acquisitions (Charter Hall and Ampol), and improve efficiency and productivity to win market share (Coles).
Looking at the negative side of the ledger, James Hardie, CSL, Telix Pharmaceuticals, Reece, and Ramsay Healthcare reported poorly received results by the market. The common themes for the group included a weaker housing market across both the United States and Australia (James Hardie and Reece), revenue growth slowing (CSL and Telix Pharmaceuticals), and a decline in profit margins due to higher interest costs and wage inflation (Ramsay Healthcare).
Result of the Season
Typically, the result of the season is a small company that surprises the market with an unexpectedly good outcome. Still, for August 2025, Atlas have chosen the very large and somewhat boring conglomerate Wesfarmers. Wesfarmers shares were priced for perfection heading into the results, and that is largely what they delivered, something that rarely occurs, and with profit growth far ahead of Australian GDP growth, unusual for such a large company.
Wesfarmers delivered a robust set of numbers this reporting season, with earnings rising 14% to $2.9 billion—a result that reflects the quiet compounding power of operational discipline across its retail portfolio. The standout performer was the Kmart Group, which saw earnings climb 9% on the back of productivity gains from integrating systems across Kmart and Target. While Bunnings remains the crown jewel with its enviable 12% profit margins and a staggering 72% return on capital, the real surprise packet was Kmart. Once the underdog, Kmart has emerged as a serious contender, posting $1,046 million in profit—up from pre-COVID margins of 6% and a 30% return on capital to now 9% margins and a 68% return. Much of this uplift can be attributed to the success of its Anko brand, which continues to resonate with value-conscious consumers. In contrast, Woolworths‘ BigW reported a $65 million loss, underscoring the divergence in execution between the two discount retailers.
On the capital management front, Wesfarmers continued its shareholder-friendly approach, announcing a fully franked dividend of $2.06, up 4%, and reaffirming its progressive dividend policy. Importantly, the Dividend Reinvestment Plan will be neutralised, with shares purchased on-market—a move that avoids dilution and signals confidence in the share price. To top it off, Wesfarmers will return additional capital via a $1.50 special dividend, split between a $1.10 capital component and a $0.40 special dividend, offering a tax-effective cherry on top for long-term holders.
How did we go?
Overall, we are reasonably pleased with the results from the reporting season for the Atlas Portfolio. In general, the companies in our portfolio were able to increase earnings and dividends, with some reporting record dividends in a more challenging economic environment. This pleasure was tempered by companies such as Sonic Healthcare and CSL falling sharply despite reporting record profits and dividends.
As a long-term investor focused on delivering income to our investors, we closely examine the dividends paid out by our companies and whether they are growing. After every reporting season, Atlas looks to “weigh” the dividends that our investors will receive. While share prices fluctuate every second between 10 am and 4 pm, driven by changing market emotions, the primary reason for buying a share is to gain access to a share of the company’s profits, which are paid out in the form of dividends and associated franking credits.
Using a weighted average across the Portfolio, our investors’ dividends will be +6% greater than the previous period in 2024, and significantly ahead of the -2% decline across the wider ASX.