Investors brace for $15b dividend pandemic wipeout
Normal text size Larger text size Very large text size Shareholders are forecast to lose as much as $15 billion in dividends that would have been payable over the six months starting on July 1, as companies slash or cancel payments due to the heavy financial impact of the coronavirus pandemic.
Blog
Making Hay in the Coronavirus Sun
The upcoming August reporting season is likely to be one of the most difficult for ASX listed companies with lock-downs and travel bans to contain the spread of Covid-19 seeing sharp and unexpected falls in revenue. Uncertainty as to when economies globally will open up and the impact of high unemployment has made it very difficult for companies to forecast future profits. The August season will be the toughest since 2008, though probably not as bad as 1992, which was the last time the Australian unemployment rate was above 10%. In 1992 Westpac came close to going under and ANZ Bank recorded a $1 billion loss in the aftermath of the early 1990s property crash and bad loans to 1980s entrepreneurs.
However, reporting season won’t be uniformly grim for Australian corporates. In this week’s piece we are going to look at the few potential bright spots in upcoming profit reporting season.
Hardware Therapy
The quarantining associated with Covid-19 has seen a significant increase in consumers staying home and therefore having the time to address household jobs that could more easily be put off on weekends when family commitments, outings and professional sports beckon. The Covid-19 crisis has been a boon for certain industries such as pest exterminators, with house-bound workers more aware of spider, cockroach and ant issues that become more urgent when reported in real-time by one’s spouse. Similarly, hardware stores have had seen solid sales as individuals with time on their hands tackled postponed DIY projects. In early June Wesfarmers reported that sales were up +19% in 2020, a significant gain for a company that dominates Australian hardware with a market share of over 50%. Wesfarmers also benefited from working from home during Covid-19 with their Officeworks division seeing sales up +28% in 2020 as printers, stationery and computers flew out the door.
Staying Home with Electronics
Electrical retailers JB Hi-Fi and Harvey Norman were deemed “essential services” during the Covid-19 lockdown. Foot traffic in their stores was as busy as supermarkets, despite operating in shopping centres with most other retailers closed. I visited JB Hi-Fi several times to buy electronic devices, computer games, and products to boost my home wi-fi that was struggling to accommodate two working adults and three home-learning children. In 2020 JB Hi-Fi reported sales growth of 20%, a solid outcome given 10 of the company’s 303 stores had been closed. Also, the company reported that its white-goods focused chain the Good Guys saw sales up +24%, indicating that consumers were diverting funds typically spent on travel to improving their home environment.
Avoiding Public Transport
While toll road owner Transurban has not benefited from Covid-19, unlike other “travel stocks” it has recovered far quicker than expected from the shut down in the economy. In March the media painted a doomsday scenario for Transurban, with roads empty for months due to social distancing – similar to what SYD is now experiencing with passenger volumes still at 3% of the monthly average seen in 2019.
Traffic did fall in late March and early April, but has recovered sharply to around 80% of pre-Covid-19 volumes, with many commuters choosing to drive to work rather than use public transport. Traffic from heavy vehicles that attract 3x the tolls compared to cars barely fell during Covid-19, as construction continued and online shopping supported traffic numbers. Indeed in Sydney, the average daily volume of trucks on Transurban’ss Sydney toll roads are now above where they were in February 2020.
Food Glorious Food
Grocers Woolworths, Metcash and Coles have seen record sales growth in 2020 as quarantining, restaurant closures, and hoarding of staples saw shoppers flock to their supermarkets. Similarly, without pubs and restaurants open for business bottle shops were deemed an “essential service,” with Woolworths’ BWS and Coles’ Liquorland being the sole port of call for the nation’s drinkers. Indeed, in March, Coles placed a daily purchase limit of either a case of beer or three bottles of wine.
In 2020 Woolworths reported supermarket sales growth of 10% and liquor sales up +15%: impressive growth for a company that, due to the size of its market share, generally is only able to grow sales at around Australian GDP growth. However for Woolworths, 2020 earnings are projected to match last years. Higher sales will likely be offset by increased costs to serve customers, as well as the impact of the company’s 294 hotels being closed. As restrictions ease and restaurants re-open, this sales growth is likely to moderate. It is worth noting that historically, higher levels of unemployment have had a positive impact for grocery sales, as more price-conscious consumers cook at home rather than visiting restaurants and cafes.
Blood from a Stone
Biotherapy company CSL which is the second-largest company on the ASX, sells life-saving medical products and vaccines that are generally unaffected by economic cycles. However, Covid-19 is likely to have an interesting impact on the company’s earnings in the medium term. Unlike other pharmaceutical companies such as Merck or Pfizer, CSL’s products are derived from blood plasma sourced from donors. This is different from giving blood as a large amount of blood is removed from the donor, the blood plasma separated in a centrifuge, and then the protein-depleted blood is then returned to the donor.
Around 70% of the global blood plasma is sourced from donors in the USA which, unlike Australia, allows companies such as CSL to pay donors around $50 a visit to collect blood plasma; this earns the USA the sobriquet the “the OPEC of plasma collections”. Due to social distancing and the wider impacts of the pandemic in the US, we would expect CSL’s collections to be down in 2020, thus impacting earnings in 2021. However rising US unemployment is likely to result in increasing collections over the next few years. During the GFC, CSL saw both higher volumes of plasma being collected through their network of 200+ centres, and reduced the payment for donations.
Services going Unused
As a result of lockdowns across Australia, there has been a significant decline in hospital admissions, as elective surgery is deferred and the number of accidents has decreased. In May private hospital surgical admissions fell by 21% (vs long term average of +2.4%) reflecting the impact of the COVID-19 slowdown. With hospital admissions down meaningfully in 2020 and private health insurance premiums paid upfront, private health insurers NIB and Medibank Private should show solid profit growth for 2020 in August. However, this earnings tailwind should begin to reverse as delayed elective surgery is rescheduled for 2021.
Similarly, motor vehicle insurers Suncorp and IAG will see higher earnings in 2020 from a fall in motor vehicle accidents. In May Suncorp reported a 25% decline in motor vehicle claims for March and April, mirroring the 15% reduction (or 77 fewer deaths) in the national road toll in 2020 compared with first five months of 2019.
Conclusion
While shutting down of Australia’s borders to international travellers and quarantine measures will be damaging to certain sectors of the economy, it is not uniformly negative for all companies. Australians actually spend more on international travel than international travellers spend here. According to Austrade, in 2019 Australians took 9.9 million international trips spending A$63 billion, whereas foreign tourists spent only $47 billion in Australia. With international travel bans likely to be extended into 2021, a portion of the expenditure previously benefiting hotels and merchants in Bali, Whistler and Tuscany are likely to be spent on home improvement and entertainment as well as domestic travel.
Wesfarmers – CV-19 Strong Business with a War Chest of Cash

Wesfarmer’s (WES) May 2020 market update saw a 20% increase in revenue that was helped buy COVID-19 government restrictions. Australians flocked to Officeworks for work-from-home purchased and Bunnings for DIY-catch-up at home.
Hugh Dive from Atlas Funds Management reviews the company through the Quality Filter Model and determines that WES is a a strong part of the portfolio, but not one to be bought at the current prices.
Transurban – Resilient Bond Proxy

May Newsletter
- May saw a continuation of the recovery in the property market as the number of new cases of CV-19 in Australia has slowed and the government announced plans to reopen Australia by July. The Australian share market received a boost after the government announced in late May that due to reporting errors, the expected cost of the JobKeeper wage subsidy program is expected to cost $60 billion less than previously estimated.
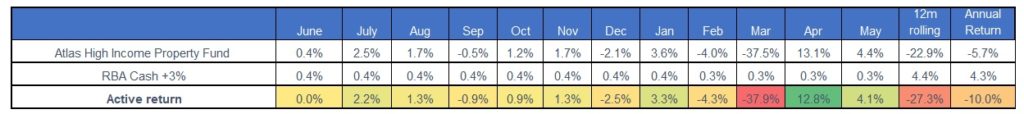
- The Atlas High Income Property Fund gained +4.4% over the month. Pleasingly several holdings in the portfolio not only gave trading updates showing that their businesses have been less impacted by CV-19 than initially feared, but also confirmed their upcoming June distributions.
- While the property sector faces challenges in 2020 due to a weakening economy, not all assets face the same challenges as discretionary retail; with office, industrial and infrastructure tenants mostly keeping up with their rental obligations. June is likely to be a critical month for listed property, as the opening up of the economy will give landlords greater certainty as to their earnings profile over the next year.