

Blog

Reporting Season Themes
Over the past
Outperforming low expectations
In the lead up to the
February reporting season, the overall mood was quite pessimistic as the summer
break was dominated by talk of slowing global growth, a trade war between the
US and China and fears that the Hayne Report to be released on the 4th February
would be very negative for Australian financial companies. We had a different
view and indeed were looking forward to the release of company financial
results, as many companies had seen their share prices fall on vague global
macroeconomic fears despite these factors ultimately having minimal impact on
their business’ sales and profits. While a trade war between the US and China
is likely to result in a decline in the demand for iron ore, it is unlikely to
change demand for CSL’s
haemophilia therapies, Amcor’s
food and drinks packaging, or doctors ordering pathology tests from Sonic Health.
The February 2019 reporting season was pretty solid for Australian listed
companies with the companies in aggregate reporting earnings growth of +4%.
This growth, however, was propped up by the resource sector (+13%) which
outweighed falling earnings in the industrial companies, and the financials
sector which came in close to the ASX 200 average. In February the ASX 200
gained by 6%, the strongest monthly return of any developed share market,
principally due to a better than expected reporting season and a rally in the
financial stocks after the Hayne Report made few recommendations that are
likely to impact their business models.
Give me my money (and franking credits) back!
Capital management was the dominant feature of the recent reporting season,
with companies opening up their purse-strings in moves that appear designed
both to reward shareholders and to get franking credits into the hands of their
shareholders before a change of Federal government. New share buy-backs were
announced by Brambles,
Qantas, Caltex and Janus Henderson. Additionally, Rio Tinto, Wesfarmers, Flight Centre
and Suncorp
announced special dividends. Atlas expects capital management again to feature
heavily in the August 2019 full-year profit results, especially with companies
such as Commonwealth
Bank receiving the proceeds from selling Colonial in June
and therefore having a large number of franking credits sitting on their
balance sheet.
Across the ASX, the dividend payout ratio remains high at around 76%.
Increasing dividends and buying back stock boosts share prices in the short
term. Such a strategy may allow some management teams to achieve share price
hurdles related to their bonuses. However, in the longer term, companies do
need to retain cash to reinvest in their operations to grow. In contrast to the
ASX’s high payout ratio is the lower 36% dividend payout ratio of the US’s
S&P 500. A lower average dividend payout ratio reflects both a greater
prevalence of buy-backs as a means of returning capital to shareholders and a
higher reinvestment in growing company earnings. However after ten years of
growth coming out of the GFC and rising global asset prices stemming from
quantitative easing, in 2019 we would prefer to see capital returned to
shareholders rather than being used on significant acquisitions that may not be
value accretive.
Rising Costs
Another key theme coming out of February and subsequent meeting with management
was rising costs and their impact on profit margins. Unsurprisingly the
financial stocks highlighted rising compliance and customer remediation charges
stemming from the Royal Commission into Financial Services. Commonwealth Bank
announced risk and compliance expenditure had increased to $432 million and AMP announced
remediation provisions of $780 million. Embattled financial services company
IOOF revealed a $10 million provision resulting from the Royal Commission which
saw its share price jump by over 30%, though we suspect that when a new CEO is
appointed the level of provisions will increase substantially. Across the rest
of the ASX companies experienced higher raw material prices (Amcor and Pact), higher
wages (Coles
and Woolworths),
and increasing energy prices (Rio
Tinto and Boral).
Rock diggers solid, but is this as good as it gets?
The miners reported solid profit growth in February, but this was expected as
they continued to benefit from elevated commodity prices. This elevation is
associated with the tail end of a Chinese stimulus plan from late 2016 and
rising iron ore prices in 2019 courtesy of a tailings dam collapse in Brazil.
On the conference calls to investors, management teams from the mining
companies promised to maintain capital discipline, pay down debt and not waste
the windfall of temporarily higher commodity prices. This approach was
positively received by shareholders who have seen windfalls from successive
resource booms being squandered by successive management teams. Over the past
six months, BHP
reduced their net debt by 36% to US$9.9 billion and RIO Tinto ended
the period in a net cash position. Additionally, both companies have been
returning capital to shareholders over the past six months, which is a nice
change from their traditional strategy of making a major acquisition at the
peak of the commodity price cycle.
Domestic outlook murky
Companies exposed to domestic consumer confidence mostly reported minimal
profit growth and revealed heightened concerns about future earnings growth.
Over the past year, we have seen house prices fall 11% in Sydney and 9% in
Melbourne, which appears to have resulted in a wealth effect where declining perceptions of
personal wealth have hurt consumer spending. Companies exposed to residential
property such as Boral
and Stockland
provided very cautious outlooks as to the future. Subdued revenue growth from
supermarket companies Coles and Woolworths indicate a cautious consumer. New
car sales fell in late 2018, as weaker hose prices deterred consumers from
using their mortgage offset accounts to purchase a new vehicle. The impact of
this can be seen in the profit results from car retailers Autosports and Automotive Holdings.
In February the news was not all bad for companies exposed to the increasingly
nervous consumer with Bunnings recording profit growth of 8%, an impressive
outcome given the deteriorating residential market. Similarly JB Hi-Fi – which
is one of the most shorted stocks on the ASX – posted profit growth of 5%,
which was above the pessimistic expectations of many in the market. While the
nervous Australian consumer is cutting back on new car purchases, they are
still spending on home hardware, lawnmowers and electrical devices.
Best and worst results
Over the month, the best results were delivered by Magellan, Cleanaway Waste, A2 Milk, CIMIC and QBE Insurance. The common theme amongst these companies was management being able to keep costs under control while growing revenue at a rate greater than their competitors. IOOF’s and Ramsay’s share prices suggested that these companies delivered strong profit results, but the price reaction was more due to these companies beating low expectations.
On the negative side of the ledger Blackmores, Pact, Bingo and Cochlear all reported disappointing results compared with other companies. The common themes amongst this group were either high price-to-earnings rated companies not delivering on high expectations or companies that reported lower profit margins as management struggled to contain cost growth.
Our take
In contrast to other reporting seasons, this one was a relatively benevolent one for quality-style investors who eschew high priced growth stocks and focus on owning companies that are likely to return capital to investors. In February we were pleased to see the companies in the portfolio growing dividends by +32% on an average weighted basis excluding special dividends. While we expect companies with offshore earnings to have a solid 2019, commodity prices (which we expect to weaken) and the impact of a Federal election are likely to put pressure both on the miners and on those companies exposed to the domestic economy
SMH: CBA puts wealth, mortgage broking spin-off on backburner
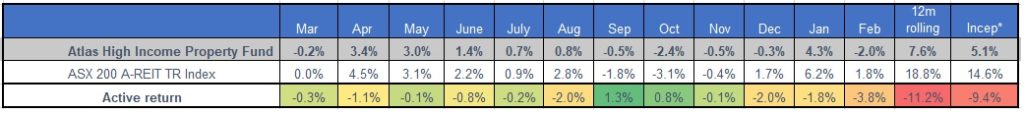
February Monthly Newsletter Atlas High Income Property Fund
- The S&P/ASX 200 A-REIT index had a solid month in February returning +1.8%, though this number does not reveal the dispersion of returns among the Listed Property Trusts, with the developers dragging up the overall index’s return.
- The Atlas High Income Property Fund fell -2% in February, reflecting our conservative positioning towards higher yielding rent collectors with recurring income and away from Trusts relying on development profits.
- Historically, the Trusts with development earnings both see earnings growth and a multiple expansion towards the end of a property boom. As developers such as Goodman are trading on close to 25 times forward earnings, the market is effectively assuming that this source of profits will both grow and continue indefinitely. We are encouraged that the Fund is utilising the right strategy after seeing articles praising aggressive approaches to property management such as “Listed real estate is no longer boring”. We saw similar articles in 2006 and 2007, praising Goodman and Centro and their new age approach to property.
Go to Monthly Newsletters for a more detailed discussion of the listed property market and the fund’s strategy going into 2019.