Over the last two weeks investors have been bombarded with a range of financial commentary, some of which comes with the conclusion that investors should sell everything as we are facing price falls in 2018 similar to what happened during the GFC a decade ago. This intensified after the S&P 500 fell -3% on Monday, its biggest one-day fall since 2012.
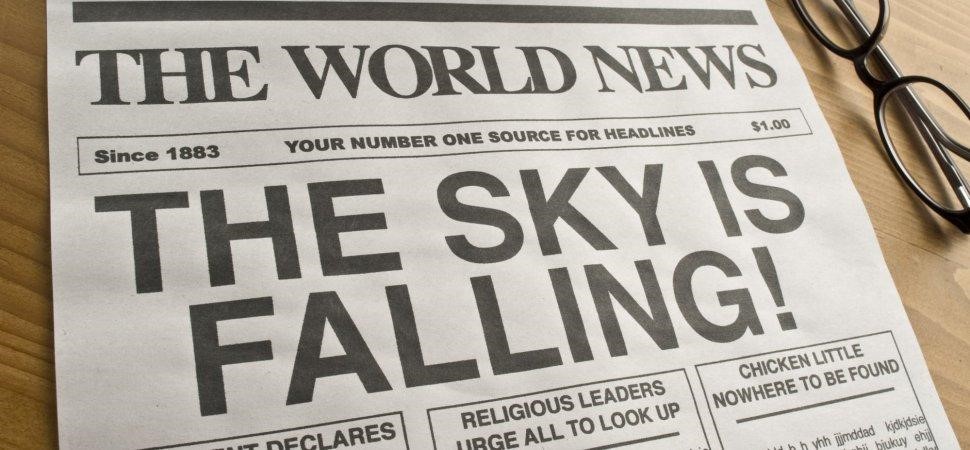
In this week’s piece we are going to look at some of the factors behind February’s fall and subsequent market volatility, and how we approach investing during times when the Chicken Littles are suggesting that “The sky is falling in!”.
 Setting the Scene: A shaky background in January
Prior to the market volatility in February, the stage appeared to be set for a correction. The US market had enjoyed a two year run without a major correction, as the S&P 500 smoothly gained 54% from the 12th February 2016. In late January US stocks were trading at lofty valuations: the S&P 500 was trading on a price to earnings ratio of 21 times, fuelled by improving corporate profits and impending tax cuts.
However, the market was also concerned that if the US economy gets much stronger, we could see inflation, something that many younger analysts only dimly remembered from dusty economics textbooks. Finally, with the changeover in the leadership of the US Federal reserve occurring on the 3rd February, there was concern that the US Fed would drive up interest rates in 2018 and that this would be done too aggressively, triggering a fall in equities.
Low Volatility
Against this background, market volatility had declined to extremely low levels, as the share market enjoyed a prolonged period of smooth rally without a correction. Moreover, this low volatility extended to a range of assets including shares, currencies and bonds. The decline in volatility is something that we had observed over the past year, and which influenced income in the Atlas High Income Property Fund.
Whilst Atlas have been unhappy about the prices we have been receiving due to the low volatility, a range of hedge funds have been profiting from this phenomenon. Essentially this involves betting that stock markets would continue to remain benign. This is done by shorting the volatility of the market 1. Short volatility has been a very consistently profitable trade over the past year, collecting consistent premiums every few months from derivative positions that return a profit if the stock market does not swing wildly in either a positive or negative direction.
A Crowded Trade and the Stampede out the Door
At the end of January there was US$3 billion in exchange traded funds ( ETFs) in the US using this strategy. Amazingly two ETFs alone – VelocityShares Daily Inverse VIX Short-Term ETN, and ProShares Short VIX Short-Term Futures ETF – increased assets by US$1.7B between them in January 2018. After the first of these funds fell more than 90% in a week, Credit Suisse are in the process of shutting it down.
However, it would be incorrect to think that a few small funds alone contributed to the market falls we have seen in February. According to Bloomberg in the wider funds management universe more than $2 trillion of investments are linked to this short volatility strategy. These hedge funds are connected via systematic strategies such as short volatility, risk parity, and volatility targeting. This very profitable trade betting on low volatility soon became a crowded short, vulnerable to a short squeeze when a large number of traders are forced to try and make the same trade at the same time. A situation similar ten people trying to quickly leave a room through a doorway when a giant rat falls from the ceiling.
What we have seen over the past fortnight was the unwinding of a crowded trade, and the resulting squeeze. The market movement – as these funds unravel and hedge funds using these strategies see outflows – has fed into weakness in the underlying shares due to forced sales of equities.
1. The short volatility trade involves two constituent parts;
a) Initially selling longer-dated futures on the Volatility Index (VIX) which were priced based on the expected volatility of the S&P 500 a few months in the future. The VIX is itself derived from the volatility of options on the S&P 500 which are primarily derived from the recent volatility in the price action of the market itself. Atlas have observed the declining volatility of markets over the past year, because as a seller of covered call options, the premiums we have been receiving for the call options sold have been declining.
b) As for the past two years up until February these futures in volatility traded above the current level of volatility or VIX, provided the market remains placid, the short seller covers their short sales as the price of the future falls towards the spot price as the future expire.
Our take
Atlas considers that what we are seeing at the moment is the disconnect between the “financial economy” and the “physical economy” and an element of reality returning to stock market valuations. At the halfway mark of the February profit-reporting season, the overwhelming theme is that both Australian and US companies are making healthy profits.
When a major market dislocation occurs, the best thing for investors to do is step back and think what this particular dislocation will do to the earnings and dividends from the companies held in their portfolio. If the answer is not much and the dividend stream will be largely unaffected, then the falling market has given you the opportunity to add to positions at a discounted price. This is markedly different to the conditions that investors faced ten years ago. At that time the seizing up of the credit markets both disrupted the ability of most global companies to refinance their debt, and also saw profits fall heavily as global trade declined sharply.

