Two weeks ago, shopping centre owner Vicinity announced it would buy back up to 5% of its stock on market after it delivered its full-year results on August 15. This delivered investors an immediate 5% bounce in the trust’s share price, as the market anticipated over $500 million of Vicinity’s stock being repurchased over the next 12 months.
In this week’s piece, we are going to look at share buy-backs and why they generally have a positive influence on a company’s share price. However, buy-backs are not always positive. Next week in the second part of our deeper dive into buy-backs, we will analyse the bad buy-backs and the cheapest ones of all to execute: the fake buy-backs that create the illusion of share price support.

Buy-backs are almost universally popular with investors as they not only reduce the number of shares outstanding by which to divide a company’s profit, but they return certain capital to investors today, rather than waiting for an uncertain return tomorrow. This is important, in light of the numerous occasions where company management teams have frittered away excess cash on questionable acquisitions or hastily conceived expansion plans designed to buy growth or move into new markets.
Types of buy-backs
There are essentially two ways that a company can repurchase or buy-back its shares. They can do it on-market using a stock broker, or off-market by inviting shareholders to tender their shares for repurchase. Off-market buy backs are generally done by companies such as BHP that have large balances of franking credits, as the buy-back can be structured in a tax-effective manner for domestic investors by returning a combination of cash and tax credits. Companies such as CSL that earn the bulk of their profits offshore are more likely to buy back their shares directly from investors on the ASX as they don’t have excess franking credits.
Occasionally companies will limit the buy-back to a particular investor, though this is usually very poorly received by the wider investor base. The last company that tried to do this was Woodside in 2014 when it offered the equivalent of $48 per share to buy back$2.7 billion in shares from Shell. This failed to get shareholder approval and with the share price currently around $29, it was clearly the right move for shareholders to block this move. Currently Rio Tinto is conducting an on-market buy-back that is limited to the company’s London listed shares. This selective buy-back is being done to close the price discount at which Rio’s shares trade on the London exchange compared with the price in Australia.
Why investors like buy-backs
Signal that future prospects are good
Buy-backs signal to the markets that a company’s management has strong confidence in the future financial prospects of the company, as the company is returning what it sees as excess capital to shareholders. A weak company in a weak financial position, with nervous lenders raising concerns about the repayment of debts due is extremely unlikely to be returning capital to shareholders. As raising new capital is both time consuming and expensive (fees going to investment bankers in sharp suits), if a management team has some concerns about the outlook, they will retain excess capital on their balance sheet.
Change in capital structure
By returning cash to shareholders, the buy-back alters the capital structure of a company, by increasing the proportion of debt on its balance sheet used to fund its activities. Similarly, it increases the financial leverage or net gearing by reducing the cash component in the denominator of the below calculation.
Net Gearing = (Total Debt – Cash) / Book Value of Equity
If the company is “under-geared”, repurchasing of shares increases leverage. In the case of shopping centre owner Vicinity, due to the $1.5 billion in asset sales sold over the past 18 months, the trust’s gearing decreased to 24.7%. Buying back stock below net tangible assets (NTA) is not only earnings accretive, but it organically increases financial leverage and thus the equity owner’s share of rising profits.
Reduces the chance of poor acquisitions
A buy-back also provides investors with comfort that excess cash is not just being retained for empire building, possibly to be squandered on bad investments which tend to be made by companies in cyclical industries at their peak. A great example of this was Rio Tinto’s purchase of Canada’s Alcan in 2007, which not only drained the company of the excess capital built up by the mining boom, but resulted in an ignominious and highly dilutive rights issue in 2009.
Scares off short sellers
Buy-backs tend to cause share prices to trade upwards, as the companies’ buying puts upwards pressure on shares. When buying back shares, companies are required to file a new notice after each day when they buy shares. This notice is posted on the ASX for investors to see and details the number of shares bought and the price paid.
This may cause short sellers to close their short positions in a company conducting a buy-back (also causing upward price pressure), as they know that there will be a new buyer consistently purchasing shares in a company in which they have a short interest. Further, a company is likely to step up that program and increase buying on any share price weakness.
When I was working at a US investment bank writing research on building materials company James Hardie, I was able to observe the wave of buying from short sellers of James Hardie on the morning that the company announced a share buy-back. This pushed the share price higher than the announcement actually warranted.
Our Take
Returning excess capital to investors as distributions rather than retaining it reduces the capacity for management teams (acting as investors’ agents) to expend capital in ways that might not be in the best interests of investors. Where excess capital is returned to investors in the form of distributions and buy-backs, this excess capital sits in investors’ bank accounts rather than the company’s. If management want additional equity for an acquisition they are then required to make an investment case to their investors. We are expecting the announcements of a few buy-backs over the next few weeks, especially in the Listed Property space from trusts that are able to buy back their own shares that are trading below net tangible assets per share.
 When analysing IPOs, few have been more eloquent on this subject than Benjamin Graham, the Father of Value Investing;
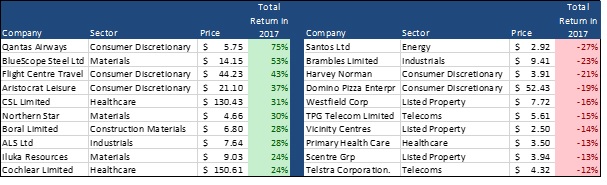
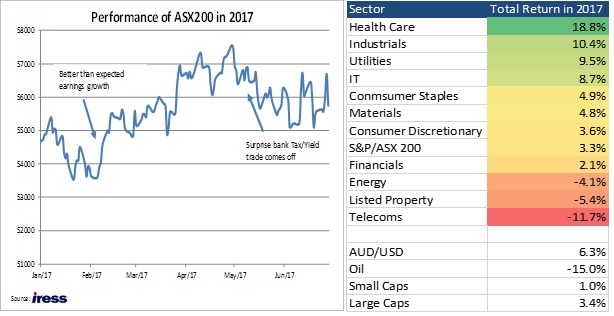 A mixed story for financials