Politics and Rising Energy Prices

Over the past few months, rising energy prices have dominated newspaper headlines, treating readers to the sight of politicians wringing their hands, promising to get to the bottom of this issue and find out who is responsible. Large power generators, energy retailers and transmission companies are accused of being behind the rising cost of lighting, heating and cooling our nation’s homes.

Whilst the profits that companies such as AGL Energy, Spark Infrastructure and to a lesser extent Origin Energy have increased over the past decade, we see that a significant proportion of the increase can be attributed to energy decisions made by various governments. As an economist, these price increases were predictable based on changes in the supply and demand curves of energy in Australia. There is scant evidence that they are the result of a long-term insidious plan by energy companies to capture a greater share of the nation ’s pay packets.  In this week’s piece, we are going to look at energy prices impacting Australia’s consumers and industrial users alike.


Energy prices this century

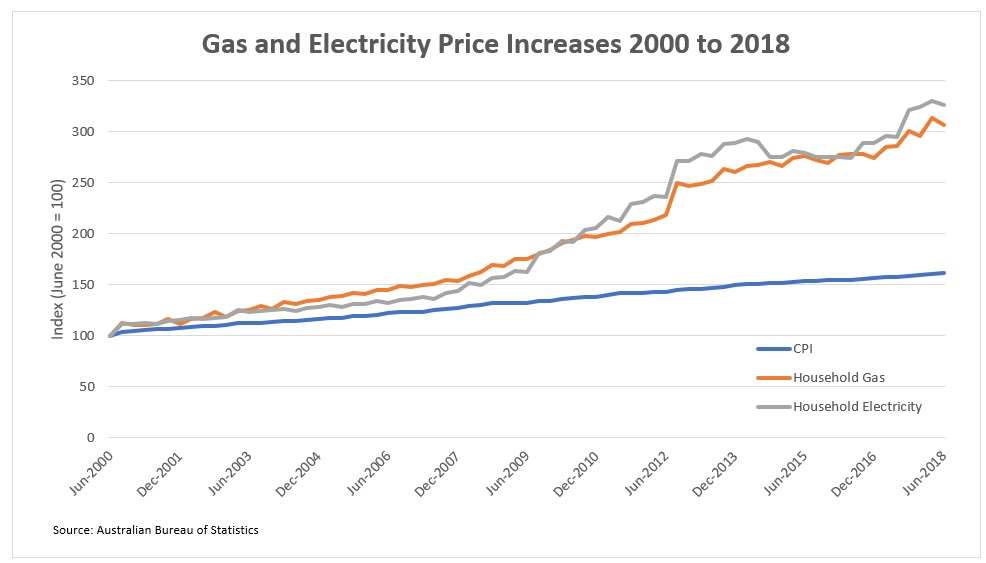
The above chart shows household gas and electricity prices in Australia and compares them to inflation. Using June 2000 as the baseline year, the CPI [Consumer price index which measures the prices paid by consumers for a basket of goods and services including energy] has risen by 61%. Over this same period, electricity has risen by +226% and natural gas by +207%.  As you will note from the above chart, energy price rises roughly matched inflation up until 2008, however energy prices have accelerated in relation to CPI particularly since 2012. It is worth noting that electricity prices are influenced by natural gas prices in that gas is used in gas-fired power peaker plants that can be fired up in response to peak periods of electricity demand.

 Gas Prices Up – a new source of demand

Due to the size of the Australian continent and the absence of pipelines linking the major fields off the coast of WA with Eastern Australia, gas prices are greatly influenced by geography. As you can observe from the below table, due to the lack of physical infrastructure WA’s gas from the giant offshore LNG fields is sold to consumers in Seoul and Tokyo rather than Sydney and Melbourne.

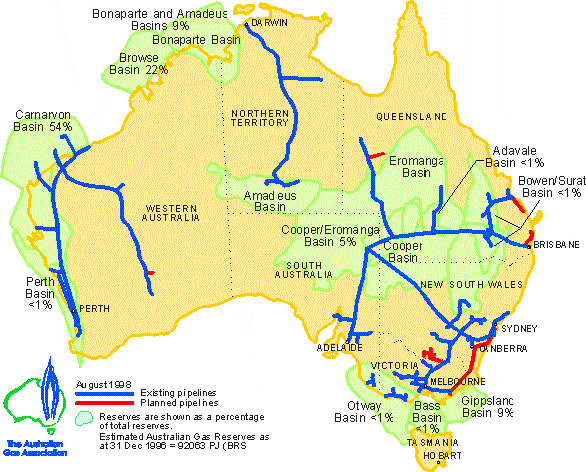
Until the construction of the construction of three liquefied natural gas (LNG where natural gas is cooled to -161 C to allow transportation) in the last five years, producers of natural gas on the East Coast of Australia could only sell their gas into the East Coast domestic market. This resulted in gas being priced below world prices for East Coast consumers. For example, in 2008 the wholesale price of 1 gigajoule of natural gas was $15 in WA versus $5 in NSW. The opening of these three export LNG plants in Gladstone in Queensland by Origin Energy, Santos and BG in 2015 and 2015 allowed the export of natural gas from  Eastern Australia to Northern Asian customers that were willing to pay over $10 per gigajoule.

Additionally, unlike in WA which mandates that 15% of gas produced in the state is reserved for domestic consumers, no such gas reservation scheme was enacted on the East Coast of Australia. AGL’s plan to construct an LNG import terminal by 2020 to serve the Victorian gas market will further link the prices that Australian consumers pay for natural gas to the world market, with gas expected to be imported from the USA and Qatar.

Consequently, with a new source of demand for natural gas being introduced and East Coast gas markets opened up to world prices, domestic prices naturally gravitated towards the higher export price. The construction of these three LNG export terminals has not only had negative consequences for consumers but due to the elevated construction costs of around $71 billion have also been a burden for shareholders with returns below expectations.

Gas Prices Up – new sources of supply halted

At the same time that demand for natural gas was increasing, a range of decisions were made by governments in NSW and Victoria to restrict new supply. Arguing about the benefits and harms of coal seam gas is beyond the scope of this piece, but economics dictates that if demand is going up and supply is unchanged, prices will naturally rise. In 2012 Victoria imposed a moratorium on coal seam gas exploration and in 2015 the NSW government banned new gas exploration. This saw AGL announce that it would not proceed with their projects in NSW and that they would be relinquishing their exploration licences. This action contributed to the energy company recording an impairment charge of $640 million in 2016.  We note that in April 2018 the Northern Territory reversed its ban on gas exploration outside towns and conservation areas in a move designed to put downward pressure on power bills.

Generation Costs Up – changing the mix and reducing supply

In the electricity market prices have been driven higher by the Federal Government’s Renewable Energy Target. This will require electricity retailers to acquire a fixed proportion of their electricity from renewable sources and is likely to result in  33,000 GWh of Australia’s electricity coming from renewable sources by 2020. Politicians seem surprised that regulations have added to electricity costs, following the closure of coal-fired base-load power stations in favour of more expensive renewables. For example, in 2017 Energie closed the Hazelwood power station that had previously supplied up to a quarter of Victoria’s electricity and AGL have announced that they will be closing the 1,680-megawatt Liddell coal-fired plant in 2022. Whilst we recognise that burning coal to generate electricity releases carbon into the atmosphere contributing to global warming, it is also a very cheap and consistent method of generating electricity. Additionally, coal-fired power plants are well-placed to provide a base-load of consistent generation, as these plans can generate electricity continuously, without requiring the wind to blow or the sun to shine.

Until the battery storage technology catches up to allow generators to store significant amounts of electricity, relying on solar and wind power generation requires natural gas-fired generation to step in to maintain consistent supply. As discussed above, this source of electricity generation is more expensive today that it was 10 years ago. Switching power generation to renewables – whilst socially desirable – comes at a cost, and this is reflected in higher energy bills. Further, in any market when supply is removed and demand remains relatively constant, prices tend to rise. This effect has proven profitable for incumbents who have generators, such as AGL Energy.

Our Take

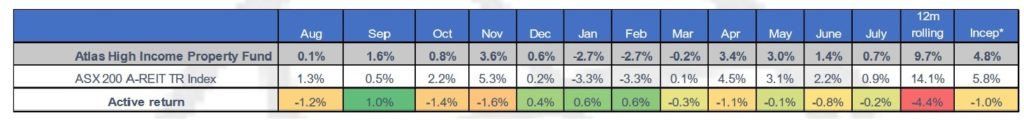
Rising energy costs have impacted consumers and industrial users alike, but they have not arisen in a policy vacuum nor as part of a conspiracy. We see that they are the logical outcome of decisions that have changed the supply and demand for energy and that various companies have predicably acted to generate profit from these shifts. In the Atlas equity portfolio, we own positions in AGL Energy and Spark Infrastructure, both of which have benefited from changes in the energy markets in Australia over the past ten years. Neither of these companies is involved in the LNG export terminals that at this stage look to be a poor investment for shareholders.

Monthly Newsletter July 2018

  • In July, the Fund gained +0.7% This is ahead of expectations given the Fund’s lower risk portfolio and high cash weight.
  • The Australian Listed Property sector continued rallying in July and has now recovered the losses sustained in the first three months of 2018. An element of this recovery is due to the view that Amazon might not be the death of Australian retailers. Over the month Amazon Australia revealed sales of just $16 million for 2017, a small fraction of JB HI-Fi’s $6.3 billion in revenue.

Go to Monthly Newsletters for a more detailed discussion of the listed property market and the fund’s strategy going into 2018.

Posted on Categories Atlas

Monthly Newsletter April 2018

  • In April the Fund gained +3.4%, which was ahead of expectations given our lower risk portfolio positioning.
  • After having a poor start to 2018 due to selling based on macroeconomic factors rather than fundamentals, the Listed Property Index rebounded sharply in April led by retail and industrial trusts.
  • The main highlight in April was the quarterly updates provided by the retail landlords. After a weak December quarter, the owners of Australia’s shopping centres reported retail sales growth of between 2-3% for the March Quarter. Whilst apparel sales were weak, this was offset by growth in food catering, cosmetics and personal services. This suggests to us to some success remixing the stores in Australia’s shopping centres.

Go to Monthly Newsletters for a more detailed discussion of the listed property market and the fund’s strategy going into 2018.


Posted on Categories Atlas

Splitting up with Coles, 1+1=3?

On Friday morning Wesfarmers announced that they are looking to demerge its Coles division to create a new ASX top 30 company, with leading positions in supermarkets and liquor. This move was very well received by the market, with Wesfarmers stock finishing up $2.60 or +6.3% on Friday, and over the weekend we have seen analysts upgrade their price targets for Wesfarmers.

The stated aim of this action is to reposition the Wesfarmers portfolio into businesses with higher growth prospects. Given Coles’ size and the concentrated market structure of the Australian grocery industry, Coles is likely only to grow at a rate similar to Australian GDP. In this week’s piece we are going to look at the Wesfarmers deal, and in particular at the rationale behind spinning out assets to form a new company.  Typically, CEOs are incentivised grow rather than shrink the size of the businesses they manage.

The Deal

Wesfarmers are proposing to demerge Coles into a stand-alone ASX Top 30 company, and existing shareholders will then own shares in both Wesfarmers and Coles. Shareholders will get a chance to vote on this action later this year with the deal expected to close in FY2019. The new company will consist of Coles and Liquorland, and Wesfarmers will retain a 20% stake in the newly-listed Coles as well as Bunnings, Kmart, Target, Officeworks, Flybuys, and the industrial and chemical companies. Critically, management expect that the distribution of Coles shares to WES shareholders will likely qualify for demerger tax relief.

Why are management doing this?

Coles operates in the highly competitive domestic food and liquor business and going forward their growth will essentially track Australian GDP growth. Currently Coles holds 33% market share of Australian supermarket spend and 16% of retail alcohol sales. Realistically it would be very hard for Coles to increase their market share meaningfully in either of these categories without provoking an immediate reaction from competitors Woolworths and Aldi. Fundamentally Coles is a stable, low growth mature business.

People more cynical than us might look at remuneration conditions for senior management in the Wesfarmers Annual Report and notice that a large portion of the CEO’s bonus is tied to delivering a high RoC (return on capital) and note that removing Coles could make it easier to hit those targets. For example, in the last six months, Coles delivered a RoC of 9%, whereas Bunnings Australia had a RoC of 47%! However, these bonus conditions may be adjusted to reflect the split.

1+1 = 3 ?

Prior to Friday’s announcement Wesfarmers had traded on a lower price earnings (PE) multiple that Woolworths, so spinning off Coles is expected to deliver a valuation uplift to shareholders. Assuming Coles trades on the same multiple as Woolworths the new company would be worth $22 billion. Prior to the announcement using an EV/EBIT (Enterprise Value divided by Earnings before interest and tax) multiple, the implied value of Coles was $18.5 billion. The uplift to shareholders from the announcement can be seen in the $2.9 billion lift in Wesfarmers’ market capitalisation on Friday.

The ignored child gets a new lease on life

The most common reason cited for a company demerging or “spinning off” a division into a separately listed vehicle is that the previously unloved division will now be run by management totally focused on it. The theory goes that as a result of this increased love and focus and not having to compete with other larger divisions for management attention and capital, the demerged division begins to prosper. Furthermore, management at the parent company benefit, as the more attractive “core” business is now re-rated upwards by the market and valued on a higher multiple. The sum of the two parts becomes greater than the original whole. We see this as one of the motives behind Wesfarmers spinning off Coles.

Recent examples of this type of strategy can be seen in Orica’s 2010 spin off of their paint division Dulux, Woolworths spin-off in 2012 of a portfolio of shopping centres into Shopping Centres Australasia Property Group, and BHP’s spin off of S32 in 2015. These three spin-offs have proved to be very successful with Dulux giving shareholders a total return of +251% vs Orica’s loss of -2%. Similarly Shopping Centres has returned +89% since it was spun out of Woolworths in 2012, against a total return to Woolworths shareholders of 12%. In May 2015 BHP demerged S32 to separate the core iron ore, oil, copper and coal assets primarily located in Australia, Chile and the US from the smaller aluminium, Columbian nickel, South African manganese, silver, and South African coal assets. Since listing, S32 has returned +50% to shareholders vs BHP’s gain of +9%.

From meeting with the new management teams of the above companies post their demergers, it was clear to me that they exhibited a great deal of pride in the results of their own smaller companies and relished controlling their own destiny outside the larger parent. Furthermore, as stand-alone companies both Dulux and S32 were able to make decisions to grow their businesses, moves that probably would not have been approved if they were still competing for capital with BHP’s and Orica’s much larger Australian mining and global mining services.

Getting rid of a problem

Whilst the above more recent spin-offs have all outperformed their parents, there have been situations where a company demerges less desirable businesses that they see might hold back the core business in the future.

BHP has previously spun off divisions in the past that they viewed as less desirable. In 2000 BHP demerged their long steel division (Arrium née Onesteel), and in 2002 their flat steel division BlueScope Steel. This was motivated by the view – which proved to be correct – that greater returns could be made from digging ore out of the ground and directly shipping it to China, rather than in manufacturing commodity steel in Australia. Furthermore, BHP was able to “spin off” the industrial relations headaches that are present in the heavily unionised steel manufacturing sector. Whilst BlueScope is currently performing well after some near-death experiences in 2011 and 2012, BHP’s long steel business Arrium went into administration in 2016.

Similarly, Amcor’s demerger of its paper low growth business PaperlinX in 2000 removed a significant management headache for the global packaging company, as the growth in electronic communications and data storage has caused a structural decline in the paper business.

Our take

Whilst the above suggests that spin-offs can unlock hidden value for shareholders, there are potential downsides. Running two separately listed companies results in Wesfarmers shareholders bearing additional costs of maintaining two separate listings on the ASX , such as two separate boards and management teams. The most consistent winners from spin-offs are the investment banks. BHP paid US$115M in fees to create South32 and the investment banks would be expected to earn similar fees from Wesfarmers.

The Mining Cycle – Booms and Busts

Unlike industrial companies such as Amcor or Transurban, profits for mining companies are inherently cyclical. The  earnings from mining companies are subject to booms and busts, largely outside the control of their management teams. This occurs as ultimately any company producing a commodity is a “price taker” not a “price maker”,  as there is no difference or brand premium between a pound of copper mined in Australia or in Chile. Due to the nature of the cycle, we see that mining stocks should not be viewed as buy and hold forever. Rather, investors should pick and choose their entry points based on where they consider that minerals are in the mining cycle.

In this week’s piece we are going to look at the five different points of the mining cycle and where in the cycle Atlas perceive that commodities are currently positioned. The chart below shows the commodity cycles over the past 200 years, with the peaks coinciding with major wars or industrialisations of large economies.


1. Demand for commodities drives up prices
In the short term, supply is relatively fixed for most commodities as miners have optimised their mines for a specific level of production and minimal exploration during the lean times has run down ore reserves. At stage 1 of the cycle memories of the previous bust are still pretty fresh, and there is likely to be an under supply of personnel such as mining engineers. Additionally, the few surviving mining services businesses and contractors are likely to have minimal spare capacity which could allow production to expand quickly. Further, management teams in the mining companies are unwilling to greenlight capacity expansions until they become convinced that higher commodity prices are permanent.

In recent times this occurred in 2004 and 2005 as the industrialisation of China delivered a new buyer for Australian materials. This saw copper increase from $1 per lb in 2004 to close to $4 per lb in 2008 as supply was relatively static despite increased demand.

2. New Exploration undertaken to add to supply and Takeover activity surges

At stage 2 of the cycle, management teams at the mining companies are likely to be running existing mines at full capacity and have developed some confidence that elevated prices will persist for some time. This incentivises new exploration and capex is allocated to bring previously uneconomic discoveries into production.

At this stage we also see surging M&A as companies use excess capital built up in Stage 1 to buy growth which can be delivered faster through a takeover than developing new mines.  An example of this was the 2007 acquisition of Alcan by Rio Tinto for US$38 billion.

3. New mines start producing at the same time results in supply being greater than demand 

Due to the long lead times, in my observation a range of projects tend to hit the marketplace at almost the same time. Additionally, from speaking to resource CEOs during stage 3, each of them are invariably convinced that they have the best project and that rival projects won’t go ahead or get financing. Quite often a range of similar projects are all developed, with banks falling over themselves to provide finance them. Prior to stage 3 these projects look to be quite low risk with short payback times if prices are maintained (which they won’t be). Further, the costs of these projects are inevitably higher than originally forecasted due to the competition for scarce resources such as skilled labour and capital goods. A great example of this can be seen in the decision of Santos, Origin Energy and BG to construct three LNG gas projects simultaneously at Gladstone in Queensland.

The long lead times between development and first production can result in new mines coming online in market conditions quite different from when they were first conceived. A great example of this is Oz Minerals’ Prominent Hill Copper Mine which started being developed in 2006, and then came online 3 years later in 2009 at a cost of $1.2 billion. During the construction process the Copper price had fallen from $4 per lb to $2 per lb at the time of mine opening.  Similarly the US$10 billion Roy Hill iron ore mine started initial developments in 2011, with full production only being achieved in 2017.

Due to the debt burden generally incurred to develop projects, despite the fall in commodity prices at stage 3 of the cycle, many mines will boost production to cover their cash costs (including debt repayments), driving down industry margins. Given the cost of actually closing a mine (redundancies and break fees for contracts written with rail and equipment suppliers), most mining executives are reluctant to put their projects on care and maintenance to remove capacity from the industry. We saw this in 2014 and 2015 where a range of smaller Australian iron ore such as Atlas Iron and BC Iron were mining iron ore, yet were losing close to US$20 on every ton of their ore shipped, with the iron ore price at $50/t. Additionally, higher cost Chinese state-owned iron ore mines continued production despite losing money on every ton,  due to the perceived political imperative to maintain employment.

4. High cost and less efficient mines close and late cycle projects abandoned until next boom

At this stage of the cycle the canaries in the metaphorical coal mine are the contractors servicing the miners. In an effort to avoid the finality of shutting production, costs are pared back with the services businesses serving the mines the first to feel the pinch. Exploration budgets are slashed and expansion plans put on ice. These actions can push highly geared services companies such as Boart Longyear into administration. Larger mining services companies such as Downer tend to see large declines in profit as services are taken in-house by the miners and bull market contracts are re-written.

The next step at this stage is for the higher-cost producers to mothball their mines in an effort to conserve corporate cash and keep the company as a going concern. In 2015 a range of higher cost iron ore producers such as Atlas Iron, BC Iron, Arrium and Mount Gibson shut production, some of which have since been reopened. The more established mining companies at this stage will slash dividends (BHP in 2016) or raise capital to stave off worried bankers (RIO in 2009).

Complex late cycle projects that get deferred included Rio Tinto’s controversial Simandou iron ore project in Guinea which was shelved in 2016 due to concerns about the iron ore price. To develop this mine, Rio Tinto would have needed to construct both new 670-kilometre heavy freight rail line to transport iron ore shipments from Guinea’s Simandou Mountain range to the coastal city of Conakry and a sea port to load this ore onto ships. Despite the size and quality of this ore body, this would have been a risky and costly venture at this stage of the mining cycle.

5. Capitulation 

At this stage sustained falls in commodity prices forces a range of second and third tier miners into administration with ownership transferring from equity to debt-holders. The remaining lower cost miners going into survival mode, focusing in on conserving cash.  Exploration will stop, as excess supply is now expected to continue almost indefinitely.  Here a range of professionals such as mining engineers and resources analysts at investment banks will start to leave the industry.  The last part of this circle of life is the conversion of the ASX-listed shells of mining companies into “new economy” companies to speed up their listing process. For example, in the late 1990s the ASX-listed shells of the defunct mining and exploration companies from the 1980s  were reborn as “dot.com” companies.

Where are we now?

Every cycle broadly follows the curve, yet looks a little different when you are in the eye of the storm. Two years ago, in January 2016 it strongly appeared that we were in stage 4 and staring down the barrel of a long winter for commodities prices, but 2017 did not follow the expected script as commodities prices strengthened. This occurred due to China’s efforts to stimulate their property sector, slightly stronger growth in the developed world, and supply disruptions to mines such as Samarco in Brazil. Additionally, structural reforms in China aimed at reducing pollution and improving the quality of growth have increased demand for higher quality grades of commodities. 

The 2017 recovery in commodity prices has pushed us back into the mid cycle, though both companies and the investment community are very cautious. There are few new IPOs coming to market outside the exotic commodities linked to electric vehicles, minimal significant corporate takeovers being announced, and expansion activity remains subdued. In the upcoming February, reporting season will show very healthy mining company balance sheets which will hopefully result in improved returns for shareholders, rather than value destructive empire building. 

We are more cautious than most, as being pushed back into this favourable stage has occurred to some degree by the desire of the Chinese government to stimulate their property market. Chinese economic policies will not always favour Australian investors and a cooling Chinese property market (as breaks are applied) could have a chilling impact on commodity prices.