In
December Listed Property was one of the top returning sectors on the ASX
gaining by +1.7%, significantly stronger than
the ASX200 return of -0.4%. The key driver of this outperformance was strong
returns from the Trusts with significant development earnings, with the market
ignoring the impact that a weakening residential property market will have on development
profits.
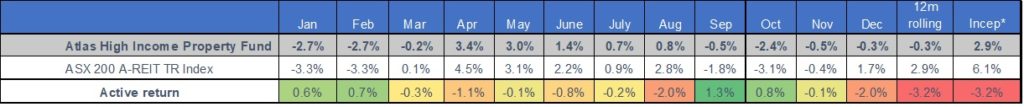
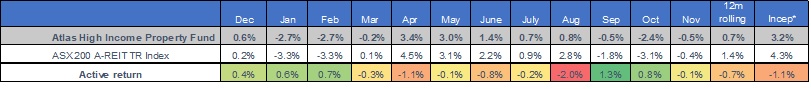
The
Atlas High Income Property Fund fell by -0.3% in December as the
rent-collecting trusts traded in-line with the overall Australian market. Atlas has
the strong view that
Trusts with recurring revenues from long-term leases will outperform those with
one-off development profits through the cycle delivering more consistent
returns to investors.
The
Fund paid a distribution of 4.6 cents per unit at the end of December.
Go to Monthly Newsletters for a more detailed discussion of the listed property market and the fund’s strategy going into 2019.
And although the number of M&A capital raisings was the lowest in 10 years, the amount of capital raised was the highest since 2011, with investors willing to put more capital into a smaller number of deals.
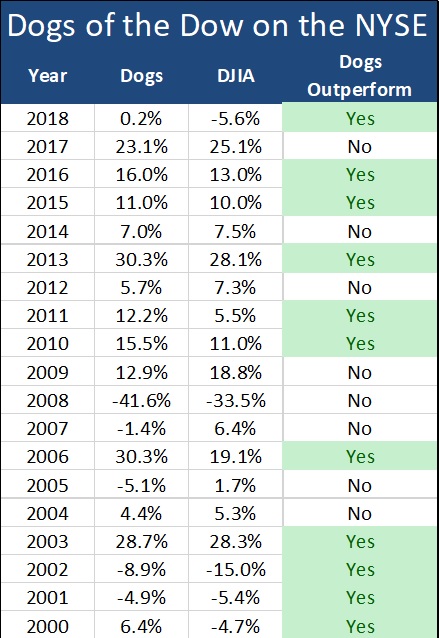
The “Dogs of the Dow” is an investment strategy that is based on buying the ten worst performing stocks over the past 12 months from the Dow Jones Industrial Average (DJIA) at the beginning of the year but restricting the stocks selected to those that are still paying a dividend. The thought process behind requiring a company to pay a dividend is that if it is still paying a distribution, its business model is unlikely to be permanently broken. The strategy then holds these ten stocks over the calendar year and sells them stocks at the end of December. The process then restarts, buying the ten worst performers from the year that has just finished. In this area, retail investors can have an advantage over institutional investors, many of whom sell the “dogs” in their portfolio towards the end of the year as part of “window dressing” their portfolio. Selling the worst performing companies avoids the manager having to explain to asset consultants why these unloved stocks are still in their portfolios.
In this week’s piece, we are going to look at the
“dogs” of the ASX, focusing on large capitalisation Australian
companies with falling share prices. Additionally, we are going to sift through
the trash of 2018 to try to discern any fallen angels with the potential to
outperform in 2019.
Unloved Mutts
The Dogs of the Dow was made famous by O’Higgins in his
1991 book “Beating the Dow” and
seeks to invest in the same manner as deep value, and contrarian investors do.
Namely, invest in companies that are currently being ignored or even hated by
the market; but because they are included in a large capitalisation index like
the DJIA or ASX 100, these companies are unlikely to be permanently broken. Inclusion
in a large capitalisation index such as the ASX100 indicates that the unloved
company may have the financial strength or understanding capital providers (such
as existing shareholders and banks) that can provide additional capital to allow
the company to recover over time. Smaller companies tend to face a harder road
to recovery with a greater chance on insolvency when they make it onto the
“Dogs” list.
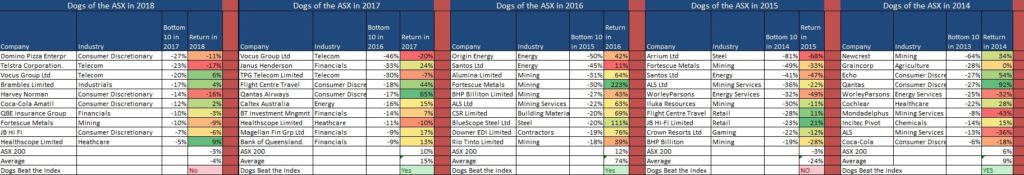
Dogs over
the Past Five Years
The table below looks at both the top and bottom performers for the past five calendar years and their performance over the subsequent 12 months. As always this is measured on a total return basis, which looks at the capital gain or loss after adding in dividends received. Whilst sifting through the trash at the end of the year yields the occasional gem – such as Healthscope in 2018 (+9%), Qantas in 2017 (+65%), Fortescue in 2016 (+223%), Qantas again in 2014 – an equal weighted portfolio of the dogs of the ASX 100 has outperformed the index in three of the past five years. In 2018 an equal-weighted portfolio of the “Dogs” effectively matched the ASX200, perhaps a fitting outcome for an unpleasant year for investors.
Source:IRESS
Themes
Looking at the above table, finding the fallen angel
amongst the worst performers seems to work best where the underperformance is
due to stock-specific problems, rather than macroeconomic issues beyond a
company’s control. For example, Cochlear underperformed in 2013 after weaker
sales as the company waited for approval to sell its new Nucleus 6 product in
the United States. Subsequently, Cochlear’s share price has gained 202%, as hearing implant sales bounced back.
Similarly, BlueScope steel had a tough 2015, which saw the company seeking government
support to help restructure their Port Kemba steelworks. Concurrently, cheap
Chinese steel took market share at the same time as key inputs of iron ore, and
metallurgical coal was climbing upwards. 2016 saw a significant turnaround for
BlueScope’s shares which gained +147% as profits recovered due to cost
controls, stronger sales and the benefits of an acquisition in the United
States.
Additionally,
where the underperformance is due to a company-specific issue, the company in
question may receive a takeover offer from a suitor that believes that they can
snap up the company cheaply and then fix their problems. The best performing
“Dog” from 2017 in 2018 was hospital owner Healthscope (+9%) that is
now the subject of a bidding war.
The common factor among the underperformers that have continued their slide in the following year is when the underperformance is tied to factors outside the company’s control, such as a multi-year decline in a commodity. From the list of underperformers in 2014, continuing declines in iron ore delivered further pain to Arrium, Fortescue and BHP’s shareholders. Similarly, a several year slide in oil prices pushed down the share prices of Santos and Worley in the subsequent 12 months.
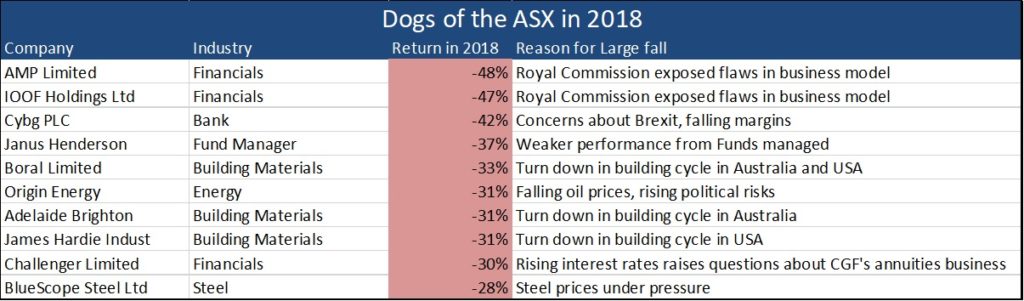
Unloved Hounds of 2018?
As a fund manager, the key question is whether there are potential show champions in the breed of unloved canines tabled below for the 2018 calendar year. Unlike previous years, the list for 2018 is more concentrated in a few sectors, reflecting industry-specific issues that have caused underperformance, rather than more easily fixed company-specific problems.
Source: IRESS
Looking
at the two vertically integrated financial advisers AMP and IOOF, it is tough
to see the near-term catalysts that will transform them into stars in 2019. The
final report from the Royal Commission into Misconduct in the Banking,
Superannuation and Financial Services Industry is due to be delivered in March
2019 and is not likely to be kind to these two companies. Similarly, the three
building materials companies in the above table are unlikely to see a reversal
of the trend of declining building approvals over the next twelve months.
Fund
manager Janus Henderson could be poised for a turn-around in 2019, with an
improvement in fund performance and further cost outs from the integration of
the two funds management companies. As the company is trading on a PE of 7
times with a dividend yield of 7%, investors have a margin of safety.
Similarly, a better than expected outcome from Brexit and an improvement in the
acquired Virgin Money business could see NAB spin-off CYBG stage a come back in
2019.
Our View
While the Dogs of the Dow
might work in a market populated with a diversified range of companies in
uncorrelated industries such as McDonalds, 3M, Merck and Microsoft, it does not
appear to be a broad strategy that one can use consistently in the ASX. We see
that amongst the companies in the ASX 100, the composition of the index is not
as broad as the Dow at an industry level. The ASX has a high weighting to
resource companies, whose profitability is primarily tied to commodity prices
(such as oil and iron ore) that are outside of management’s control and can be subject
to multi-year declines. Similarly, the ASX has a high weighting to financials,
all of which have suffered throughout 2018 from the Royal Commission.
Nevertheless, it can pay to sort through the dogs of the ASX. From the table above over the past five years, one of the top performers in the following year can be found by sifting through the dogs of the ASX100.
November was another volatile month for markets globally, though Listed Property was a steady performer in a month dominated by global macroeconomic concerns and sharp falls in commodity prices, which resulted in the ASX 200 falling -2.2%.
The Atlas High Income Property Fund declined by -0.5% in November, roughly matching the index. Over the month, several of the Trusts held in the Fund held their Annual General Meetings (AGM) where management teams confirmed that they were on track to achieve the profit guidance for 2019 given to the market in August.
Whilst Australian housing prices have been falling, residential property represents a very small part of the Listed Property index that is dominated by commercial, industrial and office real estate, sectors that have been performing strongly in 2018.
Go to Monthly Newsletters for a more detailed discussion of the listed property market and the fund’s strategy going into 2019.
The incoming chief executive of troubled wealth group AMP is under pressure to put its life insurance sale plans to its shareholders, hold onto its advisers, rebuild trust and improve its products. Former Credit Suisse executive Francesco De Ferrari starts his first day at AMP on Monday, taking on one of the most difficult CEO jobs in the country.