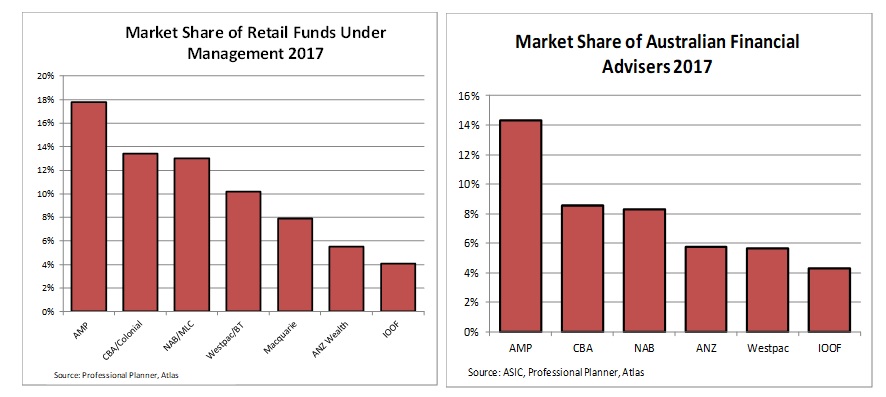
Blog

Banks Reporting Season Scorecard 2017

Over the last two weeks, investors had a wild ride following bank reporting season. In addition, in last night’s Budget a surprise levy of 0.06% on the liabilities of Australia’s five largest banks was announced. This move sparked a big sell-off in the shares of the four major banks on Tuesday in anticipation that this tax will reduce bank profits. Whilst this may occur, historically banks have been very successful in both passing on additional costs and using public relations muscle to alter government policy.

Prior to the 2013 election, the Gillard government attempted to introduce a 0.05% levy on bank deposits which was shelved in the face of a very impressive campaign from the banks. We expect that this tax will result in increased monthly loan repayments and cuts to term deposit rates, despite claims that shareholders will bear the brunt of this impost.

In this piece, we are going to look at the common themes emerging from the May reporting season, differentiate between them, and hand out our reporting season awards to the financial intermediaries that grease the wheels of Australian capitalism.

Key theme: profit growth

Across the sector profit growth was stronger than recent reporting seasons with ANZ leading the pack.  ANZ reported headline profit growth of 8% in a complicated set of financial statements, but this reduced to a still respectable 3.8% when backing out the impact of the sale of the bank’s Asian retail businesses, Esanda and property gains.  Across the sector solid profit growth was achieved by robust economic conditions and cutting costs.

Gold star to: 

Key theme: bad debt charges still very low

One of the key themes across the 4 major banks and indeed the biggest driver of earnings growth over the last few years has been the significant decline in bad debts. Falling bad debts boost bank profitability, as loans are priced assuming that a certain percentage of borrowers will be unable to repay, and that the bank will lose money where the outstanding loan amount is greater than the collateral eventually recovered. In 2016, we saw some evidence that bad debts were starting to rise to a normal level of around 0.3% of loans, though 2017 has actually seen another fall in bad debts that can be attributed to a buoyant housing markets and a recovery in commodity prices easing pressure on the mining sector. CBA gets the gold star courtesy of their higher weight to housing loans that historically attracts a low level of loan losses.

Gold star to: 

Key theme: dividend growth stalled

Across the sector, dividend growth has essentially stopped, with CBA providing the only increase of a mere 1c.  With relatively benign profit growth,  a bank can either increase dividends to shareholders or retain profits to build capital protecting a bank against financial shocks; but not both. In the recent set of results the banks have held dividends steady to boost their Tier 1 capital ratios. Whilst dividend growth across the banks is likely to be meagre in the near term, the major Australian banks in aggregate are sitting on a tasty grossed up yield of 8.3%.

Gold star to: 

Key theme: interest margins
Net interest margins in aggregate slightly declined in 2017. This was attributed to higher wholesale funding costs, increased competition for deposits and lower margins in lending to corporations. In May 2017 CBA and Westpac had the highest and most stable net interest margins, whereas NAB and ANZ both delivered lower margins. This reflects the two Melbourne-based banks having greater relative exposures to business banking and CBA/Westpac’s greater weighting to housing.

In late March 2017 the big four banks raised loan rates on average to investors, interest-only owner-occupiers, and businesses, with politically-sensitive principal and interest home loans remaining steady (for now). This followed rate rises that were pushed through in December 2016.

One of the key things we looked at closely during this results season was signs of expanding net interest margin [(Interest Received – Interest Paid) divided by Average Invested Assets], but this was not apparent. At the full year results in October and August (CBA) we may see signs of rising margins, as the full year impact of repricing loans upwards in December and March flows though.

Whilst Australian banks can be viewed as expensive globally, Australia is an attractive banking market which leads to strong and stable profit margins. For example, the major banks reported an average net interest margin of 2%, whereas European banks such as Credit Suisse earned only 1.2%. Small numbers that makes a large difference on a loan book in the hundreds of billions!

Gold star to:  Australian banking oligopoly

Key theme: total returns
In 2017 only NAB has outperformed the S&P ASX 200 total return (capital gain plus dividends) of 4.5%, as investors were concerned about potential new capital issues and a cooling of the housing market. NAB has been rewarded by investors as it has been both the cheapest bank (in price earnings terms) and has jettisoned its UK issues with the spin-off of the Clydesdale Bank and Yorkshire Bank.

Gold star to: 

Faded Blue Chips – solid stocks with feet of clay

Blue Chip stocks are the large well-established household names, in the top 50 companies listed on the ASX with a market value in the tens of billions. Stockbrokers recommend these companies to their clients based on the perception that they are safe and stable and following the axiom “Nobody ever got fired for choosing IBM“. They are viewed safe for advisors to recommend even if they fall in value. However, like Ozymandias in the poem by Shelley, strong and financially sound companies are not always permanent and can become buried in the Egyptian desert like the statue of the pharaoh.

“I met a traveller from an antique land, who said— “Two vast and trunkless legs of stone

Stand in the desert.  Near them, on the sand, Half sunk a shattered visage lies, whose frown,

And wrinkled lip, and sneer of cold command, tell that its sculptor well those passions read

Which yet survive, stamped on these lifeless things, the hand that mocked them, and the heart that fed;

And on the pedestal, these words appear: My name is Ozymandias, King of Kings; Look on my Works, ye Mighty, and despair! Nothing beside remains. Round the decay of that colossal Wreck, boundless and bare, the lone and level sands stretch far away.”

Shelley’s Ozymandias 1818

In this week’s piece, we are going to look at blue chips on the ASX over the last quarter century, the factors that caused them to decline and some thoughts on the current crop of “blue chip” companies on the ASX and their permanence.

What is a blue-chip stock?

The term “Blue Chip Stock” was first used by Oliver Gingold of Dow Jones in 1923 and referred to high priced stocks. “Blue” was a poker reference, as in poker sets the highest value chip is traditionally the blue one. Since then the term has come to denote high quality stocks, with consistent revenue growth and dominant market positions in their industry. They typically have a stable debt to equity/interest coverage ratios and generate superior return on equity (ROE).  Over time this translates into a high market capitalisation that places a company in the Top 50 companies listed on the ASX. Currently the smallest stock (BlueScope Steel) in the ASX Top 50 has a market value of almost A$7 billion.

The below table looks at the Top 50 stocks on the ASX by market valuation in four points in time over the last 26 years. There are many familiar names such as BHP and Westpac that were considered blue chips in 1991 and retain that status today, but there are also many that would be unfamiliar to many investors today. Whilst most of these (Cadbury Schweppes, North Broken Hill, PNO, Dairy Farm Holdings) have disappeared from the share market due to being taken over by other companies, in each period there are a number of supposed blue chips that ultimately went into administration or faded away to a small fraction of their previous size. The faded blue chips in the table are coloured in red. We will now examine the factors that contributed to their declines.

Too much debt

In early 2007 shopping centre trust Centro Properties was riding high after making a string of acquisitions in Australia and the USA. It was viewed as highly innovative, dubbed the Macquarie Bank of Property Trusts due to its use of debt to create a global property empire. After acquiring a portfolio of 469 small shopping centres across 38 US states for A$3.9 billion, the trust was managing A$26 billion of property. As a result of the acquisition, Centro Properties upgraded its forecast 2008 financial year distribution growth to 19%. However instead of rising distributions, in December 2007 Centro Properties faced significant problems in refinancing US$5.5 billion of debt that was due in a very challenging market. Additionally, the shopping centre owner faced questions about the accuracy of their financial accounts after billions of dollars in short-term bridging debt was classified as long-term debt. As a result of asset write offs, Centro Properties in June 2009 reported a negative net tangible assets (NTA) of -$2.23 per share (it was trading at $0.16 per share at the time). Ultimately equity holders were essentially wiped out as the mountainous debt burden was converted into equity.

Financial Engineering

In 1998 zinc miner Pasminco was one of the premier global zinc miners after buying the Century project from Rio Tinto. The company developed an audacious hedging strategy to lower debt costs by borrowing in USD and hedged the currency based on the expectation that the AUD would remain between US68c and US65c. Unfortunately, the AUD/USD fell to below 51c in 2001 at the same time that the zinc price crashed. This left the company with limited cash flow and losses on the hedge book that blew out to $850 million when the company went into administration in late 2001.

The combination of too much debt and financial engineering

No discussion of faded blue chips would be complete without looking at investment bank Babcock & Brown. At its peak in June 2007, the investment bank was lauded as a creative user of financial structuring and a fee-generating machine that propelled the company’s share price to $34.63, with a market capitalisation above $9 billion. From meetings that I had with Babcock & Brown management prior to the GFC, they also made no secret of the fact that only a small amount of their earnings could be characterised as “recurring” and that most of the profit (used to pay dividends) was generated by revaluing assets cannily acquired by the company.

Similarly, to Centro, Babcock & Brown both entered the GFC with too much debt and – more importantly – too much short-term debt that needed to be refinanced in a challenging market. In June 2007, the Babcock & Brown group had amassed $80 billion in assets, supported by $77 billion in debt, much of this held off balance sheet or characterised as “non-recourse” and held by satellite funds.  The company collapsed in 2009 after a falling share price triggered debt covenants and the company was unable to refinance the debt due. Ultimately, in very complex liquidation proceedings the noteholders ended up receiving 2c in dollar for bonds held, with equity holders receiving nothing.

Technology that did not work as expected

The orbital engine was invented by Ralph Sarich in 1972and at one time was expected to revolutionise combustion engines, with fewer moving parts and greater efficiency.  In 1991, the future for Orbital – a company that owned the technology for orbital engines – looked bright and BHP took a 25% stake in the company. Despite this promise, a range of technical problems with cooling and lubricating the engine proved unsolvable and both the founder and BHP ran for the exits. Orbital still exists selling fuel injection technology and propulsion systems for drones, but with a share price of $0.59 which is a long way from its peak at $24.

ERG’s future looked bright 17 years ago and was a glamour tech stock listed on the ASX offering smartcards for mass transit systems from Moscow to Manila. Whilst the technology itself was sound the company was effectively sunk, not by the offshore moves but by difficulties in implementing the ERG’s T-Card in Sydney and issues with the NSW State Government which led to the project being scrapped.  Ultimately this resulted in lawsuits and the company was delisted in 2009.

The above table shows the ASX Top 50 as of April 2017 ranked by market capitalisation.  Whilst it is usually hard to identify at the time which strong companies will falter in the future, history strongly suggests that amongst this list there are one or two companies, currently considered blue chips that will either go into administration or slide back into insignificance. Below we identify some considerations that might influence the future fates of current blue chips.

High Debt

In 2013 Fortescue looked like a candidate for a blue chip that might blow up, with 70% gearing resulting from $10.5 billion in net debt. However, a period of sustained high iron ore prices has allowed the company to pay off $6.5 billion in debt and reduce gearing to a more manageable 30%.

Amongst the blue-chip stocks in the table above, the companies with the highest debt burden as measured by gearing (net debt divided by total equity) are Sydney Airport (770%), APA Group (242%), Transurban (225%) and Ramsay Healthcare (135%). The key characteristic of these heavily geared companies is the view that the stable returns from airports, pipelines, toll roads and hospital procedures affords the ability to service high levels of debt.

Whilst these companies own wonderful assets and point to both the spread of debt maturities and their interest rate hedges (which lock in a portion of the company’s debt at a fixed rate), these hedges will expire and debt currently attracting low rates will almost certainly have to be refinanced at higher rates. For example, in the five-year period 2020 to 2024, Sydney Airport will have to refinance on average $806 million in debt per year.

Technology does not work as expected

Whilst we do not consider this likely and believe that the company has instituted many safeguards, blood therapy company CSL does face the risk of product recalls through contamination. In 2008, CSL’s rival Baxter faced a product recall after 81 deaths were linked to tainted blood thinning drugs produced under contract in China, but sold in the US under Baxter’s name.

 Left Field

Political factors could potentially derail BHP spin-off S32, which has climbed into the ASX Top 50 courtesy of higher coal and manganese prices. In February S32 reported that 35% of their profits were earned from the company’s coal and manganese mines and aluminium smelters in South Africa and Mozambique. Significant political unrest, power disruption from Eskom or amendments to South Africa’s 2002 mining charter requiring higher percentages of black ownership could result in significant falls in S32’s share price.

Our Take

We see that investors spend far too much time trying to pick the next Apple or CSL and not enough time thinking about whether there is a Pasminco lurking in their portfolio. Rather than chasing high return and higher risk investments, Atlas observes that superior performance and lower volatility of returns are best delivered by concentrating on avoiding mistakes or “performance torpedoes”.  Looking at the current list of blue chip stocks, we consider that the most probable candidate to become a fallen angel is likely to come from the list of highly geared utilities.


What is going on in Listed Property

In this note we will look at what is going on in listed property,  the key themes to emerge over the past month from the profit results and how we expect listed property to perform over the next year. Given the name of our firm it would be remiss not to mention that this week marked the 60th anniversary of the publication of the Ayn Rand novel Atlas Shrugged. This novel provides an examination of whether the pursuit of profit is a noble enterprise or the root of all evil and the conflict in society between thinkers relying on facts and those defying reason, supporting their arguments on feelings.

Since 2012, listed property has been one of the top performing sectors on the ASX 200. During this time, other sectors in the equity market have faced concerns about a rising and then falling AUD, volatility in commodity prices that saw BHP abandon their cherished progressive dividend policy, Eurozone issues, near zero interest rates, and bank capital raisings. Listed property meanwhile seemed to be immune to these destabilising forces.
This all changed in the second half of 2016, when “safe” stocks such as Listed Property Trusts and infrastructure stocks, considered to be alternatives to bonds or term deposits, fell heavily on expectations that global interest rates will start to rise in the future. In the February 2017 results reporting season the management teams of the listed property sector addressed investor concerns about the impact of higher interest rates and their ability to grow distributions in a higher inflation environment. This increased investor confidence and accordingly saw the Listed Property sector gain 7% from the lows reached in November 2016.
As real estate is not a homogeneous asset, it is useful to break down the real estate held by the Listed Property Trusts into four distinct groups: shopping centres (retail), office towers (office), housing and apartment developers (residential), and manufacturing or distribution centres (industrial).
Retail
Discretionary retail continues to face the challenges of on-line competition to bricks and mortar, a higher AUD, and slower inbound tourism which has reduced profit margins, particularly in clothing and footwear. Weaker retail sales limit the ability of shopping centre operators such as Scentre and Vicinity to raise rents and typically a rental contract will include a percentage of store sales. New clothing retailers Zara continue to take sales away from department stores like Myer, which is important given department stores are typically the largest rent payer in a shopping centre. Additionally, over the last year shopping centre landlords faced a few tenants closing stores due to insolvency such as Payless Shoes, Howards Storage and Pumpkin Patch.

Whilst the outlook for retail looks difficult, we do not see that shopping centres will become redundant, but they will need to evolve by favouring tenants that offer services that can’t be delivered on-line such as personal grooming and dining.

Office                                     
In contrast to shopping centres, the Australian CBD office market looks pretty healthy for owners of office towers such as Dexus and Investa Office. Vacancy is the best measure of the health of the office sector, as empty floors in an office tower don’t earn rental income for the owners of office property trusts. Overall the market looks stable, but the picture across Australia is quite divergent with vacancy at a 23-year high in Perth being offset by very low vacancies in the Sydney and Melbourne markets.  Sydney and Melbourne have benefited from the conversion of office towers into apartment buildings, which reduces supply, whilst Brisbane and Perth face excess supply from towers built towards the end of the mining boom.

Residential                                     
Unsurprisingly the buoyant residential market in Sydney and Melbourne boosted the results of major residential developers Mirvac, Lend Lease and Stockland. Going into the profit results we were concerned that these developers could face defaults from buyers that have paid deposits for apartments (particularly in Melbourne). A buyer may refuse to complete a sale (thus forfeiting their deposit) if after completion the value of the property has declined or the buyer has had trouble obtaining finance. Our concerns were allayed in February with the developers reporting minimal defaults and healthy forward sales.

Industrial                              
Although the industrial assets continue to be priced higher, the underlying fundamentals have deteriorated with vacancies rising across the sector. Unlike office towers which are relatively homogeneous assets – which means, for example, that an accounting firm can take over space vacated by a financial planner – industrial sites are often configured for a particular tenant. A great example of this is the challenges the BWP face in filling sites vacated by key tenant Bunnings. The industrial trusts have continued to generate profits from re-zoning industrial property to residential. In October Goodman sold an industrial park in Sydney’s north west for $200 million to apartment developer Meriton Group.

One Year Outlook                                   
The total return (capital growth plus distributions) that investors can expect from Listed Property based on four financial components. These are; 1) distributions, 2) movement in asset values as measured by the capitalisation rate which is the rate of return on a real estate investment property based on the income that the property is expected to generate3) expansions or contractions in the market price to earnings ratio and 4) movement in the number of shares on issue (current buy backs or equity issues).

Over the next year, we see a small increase in the average distribution yield and a slight increase in asset values. However, due to concerns about interest rates it is hard to see an expansion in the market price earnings ratio above its current long term average and there are no significant buy backs currently in operation.  Consequently, it is hard to make the case that the bulk of returns that investors can expect from listed property will not come from distributions.

Our Take

The Property Trust sector as a whole appears to be trading at a premium to fair value. We see that catalysts which propelled the sector up over the last three years have largely been played out and the majority of returns over the next 12 months will come from distributions and income from writing call options over existing holdings. The sector currently trades at a +26% premium to net tangible assets (14.2x forward PE and 5.2% yield).  The portfolio strategy of the Atlas High Income Fund of populating the portfolio with higher quality domestic rent collectors combined with a derivative overlay strategy to enhance income should outperform in this market. Further, the focus on trusts that are delivering recurring yield should result in a higher distribution yield and lower earnings volatility for our investors.

Hugh Dive CFA
Chief Investment Officer