AFR:Commonwealth Bank’s CFS planning, broking arms ‘basically up for sale’

Commonwealth Bank investors have questioned the pairing of high-value funds management operations with risky advice and mortgage broking units, but have more broadly welcomed the split of $8 billion worth of wealth businesses into a separate company.

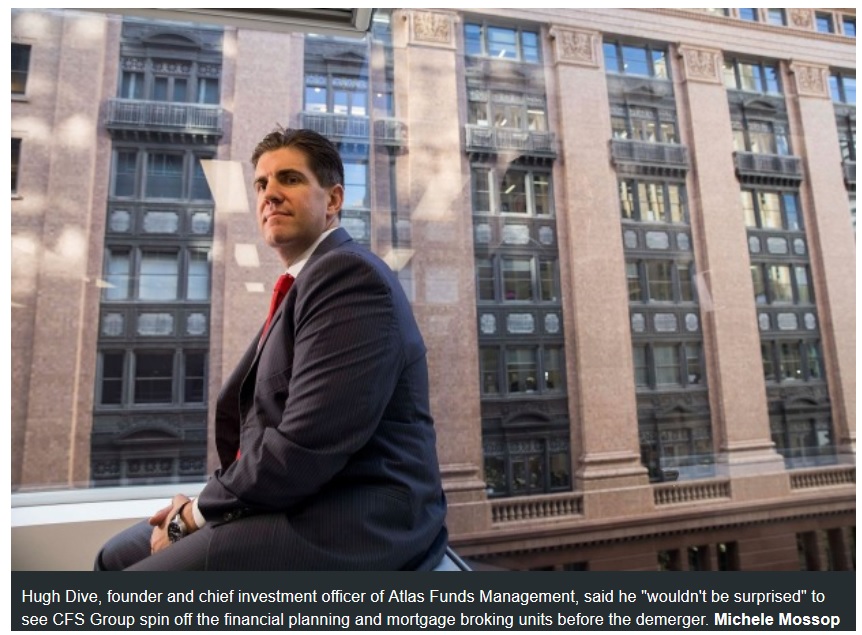
Hugh Dive, founder and chief investment officer of Atlas Funds Management, said he “wouldn’t be surprised” to see CFS Group spin off the financial planning and mortgage broking units before the demerger.

“Whilst Colonial, the funds management business and the platforms, are very good, people will discount the value of the financial planning business,” he said.

“Financial planning is not a great business to be in. Your assets walk out the door every day … the clients have a great relationship with the planner, not with the funds management house.”

Mr Dive, however, said the chances of capital return as a result of an IPO “struck me as a very low probability outcome”.

“That was a supposed disappointment, but we didn’t factor that [capital relief] as a factor at all,” he said.

Commonwealth Bank’s CFS planning, broking arms ‘basically up for sale’

Commonwealth Bank investors have questioned the pairing of high-value funds management operations with risky advice and mortgage broking units, but have more broadly welcomed the split of $8 billion worth of wealth businesses into a separate company.

AFR:ASX supports JPM chair Rob Priestley

The ASX has expressed confidence in former JPMorgan chief executive officer Rob Priestley, who headed the investment bank’s local division when the broker underwrote ANZ’s botched $2.5 billion capital raising that has triggered a cartel case against the bank and JPMorgan’s joint lead underwriters on the transaction.

Atlas Funds Management’s Hugh Dive.

“In a book-build everyone is trying to work out what the truth is, but one is expecting anyone to be telling the exact truth. If you’re a fund manager you are back and forth on the phone trying to work out what the real demand for the new IPO or placement really is before bidding. If you get the full allocation you asked for, then you have misjudged demand and are likely to lose money when the stock re-opens trading at a lower amount.”

ASX supports JPM chair Rob Priestley

The ASX has expressed confidence in former JPMorgan chief executive officer Rob Priestley, who headed the investment bank’s local division when the broker underwrote ANZ’s botched $2.5 billion capital raising that has triggered a cartel case against the bank and JPMorgan’s joint lead underwriters on the transaction.


Torpedo Tuesday – JB Hi-Fi (Swings and Roundabouts Ep. 183)

JBH has doubled revenue over the last five years with steady growth, acquisitions and over-hyped impact of Amazon arriving in Australia. Hugh Dive from Atlas Funds Management unpacks JBH for investors, identifies the areas of concern and makes the call of whether JBH is an investment to be made today.

click here to launch the link

Torpedo Tuesday – 5 June 2018 – JB Hi-Fi (Swings and Roundabouts Ep. 183)

No Description

Losing money overseas

In the travel sections of newspapers there frequently appear articles with titles such as Top 7 Overseas Travel Scams (and How to Avoid Them). However, Atlas see the biggest cause of Australians losing money overseas is not pickpockets, dodgy taxi drivers, or pre-damaged jet skis, but rather ill-conceived offshore acquisitions by Australian corporates.

Last Friday the latest of these came to an end with Wesfarmers exiting their UK Hardware operations. Over the two and a half years of ownership, this adventure cost Wesfarmers shareholders A$1.7 billion. What is worse is that for shareholders of Wesfarmers, booking the loss and selling these operations for one pound is a good outcome as it avoids significant closure costs. At Atlas, based on bitter experience we are very sceptical about offshore acquisition strategies embarked on by Australian corporates. In this week’s piece, we are going to look at offshore expansion by Australian companies.


Why Australian companies expand offshore

The main reason expounded by Australian corporates for offshore expansion is to gain access to larger pools of potential customers for the purpose of driving earnings growth. In many industries, Australian companies operate in oligopolies or are constrained by government regulators such as the ACCC (Australian Competition & Consumer Commission) from growing rapidly through either price competition or acquiring competitors.

In the banking or grocery industries, neither Westpac nor Woolworths are able to take market share from competitors by dropping prices, as their competitors will immediately match their moves. Similarly, a move by Westpac to acquire the smaller Bank of Queensland would have difficulty getting approval from the ACCC.

Other reasons touted for global expansion are access to new technologies and diversification, since business or regulatory conditions in certain foreign markets may not be correlated with those in Australia. For example, Sonic Healthcare is not likely to face simultaneous fee pressures in their pathology businesses in the USA, Australia and Germany. Where management teams are under pressure and incentivised to grow earnings each year, it is understandable that they could be seduced by an investment banker in a two-thousand-dollar suit selling dreams of global expansion.

We will now go on to examine some of the mistaken assumptions that motivate international expansions.

Wrong move 1: We are dominant in Australia, so we will dominate the world

We see that this is the most common mistaken assumption made by Australian corporates venturing offshore. Arguably this was the rationale motivating Wesfarmers when they purchased the number two player in the UK hardware market in 2016. In Australia, Bunnings dominates the $48-billion hardware sector and earns an EBIT margin of 14%, whereas Bunnings’ equivalent in the UK – Kingfisher – has an EBIT margin of 7% in a more competitive and crowded market. Firstly, Australian entrants will often face higher levels of competition in new markets. Furthermore, a successful strategy in Australia will not necessarily resonate with foreign consumers. In the case of Bunnings UK, large BBQs and cheap power tools that sell in Sydney were a surprise to UK shoppers entering a Homebase store in the UK looking for Laura Ashley homewares.

Other examples of this factor can be seen in IAG’s entry into the UK general insurance market after buying the country’s eighth largest motor insurer. Ultimately this adventure cost shareholders $1.3 billion, as IAG found the UK insurance market far more competitive than Australia where IAG, Suncorp and QBE have a 70% market share.  In a similar vein, NAB in the late 1980s and 1990s acquired banks in Northern England, Ireland and the USA, based on the strategy that their dominance in Australia would translate into other parts of the English-speaking world. Ultimately NAB was unable to run the dispersed set of financial services businesses from Melbourne and this adventure cost shareholders billions, though it would have been costlier had NAB not sold their Irish banks to Denmark’s largest bank just prior to the GFC.

However, it would be disingenuous not to mention that foreign companies also make this same mistake in buying domestic assets at high prices off canny Australians. Japan’s Kirin Breweries and UK’s SAB Miller have written off portions of the Lion Nathan and Fosters brewing assets, as sales of iconic Australian beers such as Tooheys and Victoria Bitter have declined with drinkers turning to smaller craft beers.

Wrong move 2: Let’s try something new

This version of an offshore misstep generally occurs when an Australian corporate with excess cash is presented with an opportunity to grow earnings by investing in a new technology in a foreign market. Typically, this involves buying assets from local players who typically have a better grasp on what the assets are actually worth. A great example of “Let’s try something new” has been BHP’s investments in US onshore shale gas in 2011 and 2012. BHP acquired assets of US$4.75 billion from Chesapeake, and US$15 billion for Petrohawk. BHP at the time was flush with cash due to a surging iron ore price. However, extracting shale gas in the US is more of a small scale modular process compared with BHP’s massive iron-ore and offshore LNG projects. Furthermore, BHP’s purchase was made at peak oil prices. In 2018 BHP is in the process of extricating themselves from these acquisitions, having already written off US$13 billion of this investment.

 Wrong move 3: Sort of similar to something we already do

This acquisition mistake is a close cousin of “let’s try something new” in that the acquisition is made in an area close to the company’s core area of competency and presented to investors as a low-risk form of offshore expansion.  Fletcher Building’s purchase of the Cincinnati-based Formica in 2007 for US$ 700 million from private equity was touted as a logical extension to the company’s decorative surface laminates business. In hindsight, this acquisition was made at the peak of the US housing construction cycle for a business that faced ongoing production issues due to site consolidation.

Slater+ Gordon’s acquisition of Qunidell’s professional services division in 2015 for A$1.2 billion also falls into the category of “Sort of similar to something we already do”. Whilst this infamous acquisition made Slater+Gordon the number one personal injury law firm in the UK, it also added claims management companies, insurers and insurance brokers – businesses somewhat adjacent to the company’s core litigation practice. Arguably this move helped contribute to equity holders losing 99% of the value of their investment in the company as it both burdened the company with too much debt and bought a business without undertaking sufficient due diligence.

Shortly after the purchase of Quindell, the UK government announced plans to limit the proceeds from personal injury claims and Quindell came under investigation for accounting practices that inflated earnings. See Jonathan Shapiro’s fine analysis of this transaction in Sowing the seeds of Slater & Gordon’s market demise.

No discussion of poor acquisitions would be complete without including Rio Tinto’s 2007 acquisition of Canada’s Alcan for US$38 billion, which manages to put tick most boxes of a poor offshore expansion. This acquisition arguably was made to fend off a takeover from BHP and led to Rio acquiring smelters in exotic places such as Iceland (“Sort of similar to something we already do”) and engineered products and packaging (“let’s try something new”). Ultimately US$30 billion of this acquisition was written off and resulted in a highly dilutive equity issue in 2009.

Offshore acquisitions that worked

It would be wrong to claim that all offshore acquisitions end in tears for Australian investors. A number of Australian companies have made major offshore acquisitions that have driven earnings growth for a number of years and propelled the company into a major global player in their industry. Amcor has leveraged a range of successful acquisitions to become one of the largest manufacturers of flexible packaging and rigid plastics, ironically making their most successful acquisition from Rio Tinto.

Similarly, CSL made major acquisitions in 2000 and 2004 in Switzerland and Germany and is now the largest global producer of blood plasma-derived medicines. Computershare has grown through acquisition to become one of the largest global share registry businesses, successfully buying and improving the profitability of various global banks’ unwanted registry businesses.  Sonic Healthcare has made 50 acquisitions over the past 20 years in Europe and the US. Sonic’s shareholders have enjoyed rising profits due to doctors requesting greater numbers of tests per patient and being able to run higher volumes through their increasingly automated labs.

The common theme through these successful offshore expansions is that the Australian companies have focused on a particular niche where the Australian company has some form of comparative advantage. This is very different from buying foreign banks, where the Australian company brings no intellectual capital or technology to the table, only capital!

Our take

Wesfarmers’ adventure into the UK hardware market is unlikely to be the end of Australian corporates making poor foreign acquisitions. Management teams are incentivised to grow earnings, and acquisitions are presented as a quick way to achieve this goal. Atlas is very wary of companies announcing major offshore acquisitions as for every successful acquisition there seem to be several that end in tears. The common theme is one of excessively optimistic due diligence which underestimated the level of competition in the new foreign markets and the difficulty in managing diverse global businesses from a head office in Sydney or Melbourne.

The most (and the least) profitable companies on the ASX200

In early May the major Australian banks collectively reported profits for their last six months of A$15.3 billion dollars. This resulted in some media commentary about banks being too profitable, especially as three of the banks reported in the middle of the Royal Commission into the financial services industry, which had highlighted examples of inappropriate financial advice and problems issues with lending standards.

Whilst large corporations generate large profits in dollar terms, what is often ignored in much of the debate on corporate profitability is that these profits have to be shared amongst millions of individual shareholders.

For example, collectively the banks made $15.3 billion, however, divided by 10.8 billion bank shares outstanding this crude measure equates to a mere $1.42 per share. In this piece we are going to look at different measures of corporate profitability for large Australian listed companies, looking beyond the billion dollar headline figure.

Different Measures of Profitability

As a fund manager, the $4.25 billion of cash profit generated by Westpac over the past six months does not mean very much. As an investor, I am most concerned with the underlying earnings per share (EPS), which is what the owner of a single share of the company receives from the profit generated in a particular year. In Westpac’s case, their cash earnings per share compared with the first half of 2017 grew 4.3% to $1.25 – nice growth but not particularly exciting.

We also look at growth in EPS, as often a company’s profits can grow substantially when they make an acquisition. However, if that acquisition is funded by issuing a large number of additional shares, profit per share might not actually grow. Conversely, a company’s profits may be down, but if this is due to the selling of a non-core division it could be a good result for shareholders. For example, earlier this month ANZ Bank reported a 16% decline in cash profits due to the sale of their Asian retail banking businesses. As the proceeds from the sales were used to buy back ANZ Bank shares, their earnings per share actually gained 4%. Additionally, at a company level, we also look at measures such as returns and profit margins, which can be better measures of how efficient a company’s management team is in generating their annual profits. Furthermore, these measures allow the investor to compare different companies in similar industries.

Return on Capital Employed

Return on Capital Employed (ROCE) looks at the profit generated both by the capital that the equity holders have contributed to establish the business, as well as the debt taken on to support the business’ activities.

ROCE is calculated by dividing a company’s profit before interest and taxes by the shareholders’ equity plus debt. The investment by shareholders includes both original share capital from the IPO plus retained earnings.

Retained earnings are the profits kept by the company in excess of dividends and are used to fund capital expenditure either to maintain or to grow the company. Companies with high ROCE typically require little in the way of equity to keep the business running and little need to borrow from their bankers.

The above chart shows the top and bottom companies in the ASX as ranked by ROCE. The top ROCE earners include:

  • a milk company (A2M),
  • three fund managers (Magellan, Perpetual and Pendal),
  • a healthcare company (Cochlear), as well as
  • an internet services companies (REA and Carsales).

The common factor in these businesses is minimal ongoing capital expenditure to run the company.

Bringing up the rear are a range of capital-heavy businesses that require both large amounts of initial capital to start the business and regular capital expenditure to maintain the quality of their assets and finance their ongoing activities. This subset includes a gain handler (Graincorp), logistics (Qube), retailer (Myer), healthcare companies (Healthscope and Primary), and an energy company (Santos). Typically when looking at this measure, miners, steelmakers, wineries and Qantas are prominently featured amongst the lowest returning businesses as they are operating in capital-hungry industries. However, in 2018 these three industries are currently enjoying cyclically strong earnings.

Profit margin

Profit margin is calculated by dividing operating profits by revenues. It measures the percentage of each dollar received by a company that results in profit to shareholders. Here we have used earnings before interest, taxes and depreciation as it allows us to compare companies across different industries with different capital structures, and this margin is for the six months ending December 2017.

Typically low margin businesses operate in highly competitive mature industries. The absolute profit margin is not always what investors should look at when analysing a company’s results, but rather a change in this margin. A rising profit margin may indicate a company enjoying operating leverage as profits are growing at a faster rate than costs. Conversely, a declining profit margin could indicate stress and might point to large future declines in profits.

From the above chart, the highest profit margins are generated by companies that are fund managers enjoying the operating leverage mentioned above (Platinum and Magellan), monopolies (ASX), internet businesses (REA), or energy companies (Woodside and Oilsearch).

The energy companies enjoy a high-profit margin, as once the large offshore LNG trains are built these assets have a low marginal cost of production per barrel of oil. Obviously, this metric does not account for the tens of billions in capital required to build these giant projects. BHP features in this list courtesy of the 60% profit margin that the Big Australian earns from digging up iron ore in the Pilbara when iron ore prices are around US$70 per tonne. Low profit margin companies characteristically receive large revenues but operate in intensely competitive industries such as petrol retailing (Caltex), grocery retailing (Metcash, Woolworths and Wesfarmers), department store (Myer), and construction (Lend Lease).

Companies with low profit margins are obviously forced to concentrate closely on preventing their profit margins from slipping, as a small change in their margins is likely to have a significant impact on the profit available for distribution to shareholders. For example Metcash’s food distribution business runs on a very slim profit margin, such that when the business faced declining margins in 2014 they were forced to cut their dividend, which was not reinstated until 2017. For this reason, we monitor the net interest margins of the banks very closely

Our take

While the banks and the large miners (BHP and RIO) generate large absolute profits resulting in headlines around the billions of dollars they earn, they are generally not among the most profitable large listed Australian companies in terms of profit margins and returns on assets. Over the last six months, Commonwealth Bank’s 48,900 employees produced a $4.7 billion profit, but this represented a return on assets of 1.03% and a profit or net interest margin of only 2.16% on a loan book of $962 billion. When looking at companies to include in the Maxim Atlas Core Australian Equity Portfolio, the indicators of earnings power that we look at is not the headline number, but rather its return on capital or equity and changes in profit margins.