Politics and Rising Energy Prices

Over the past few months, rising energy prices have dominated newspaper headlines, treating readers to the sight of politicians wringing their hands, promising to get to the bottom of this issue and find out who is responsible. Large power generators, energy retailers and transmission companies are accused of being behind the rising cost of lighting, heating and cooling our nation’s homes.

Whilst the profits that companies such as AGL Energy, Spark Infrastructure and to a lesser extent Origin Energy have increased over the past decade, we see that a significant proportion of the increase can be attributed to energy decisions made by various governments. As an economist, these price increases were predictable based on changes in the supply and demand curves of energy in Australia. There is scant evidence that they are the result of a long-term insidious plan by energy companies to capture a greater share of the nation ’s pay packets.  In this week’s piece, we are going to look at energy prices impacting Australia’s consumers and industrial users alike.


Energy prices this century

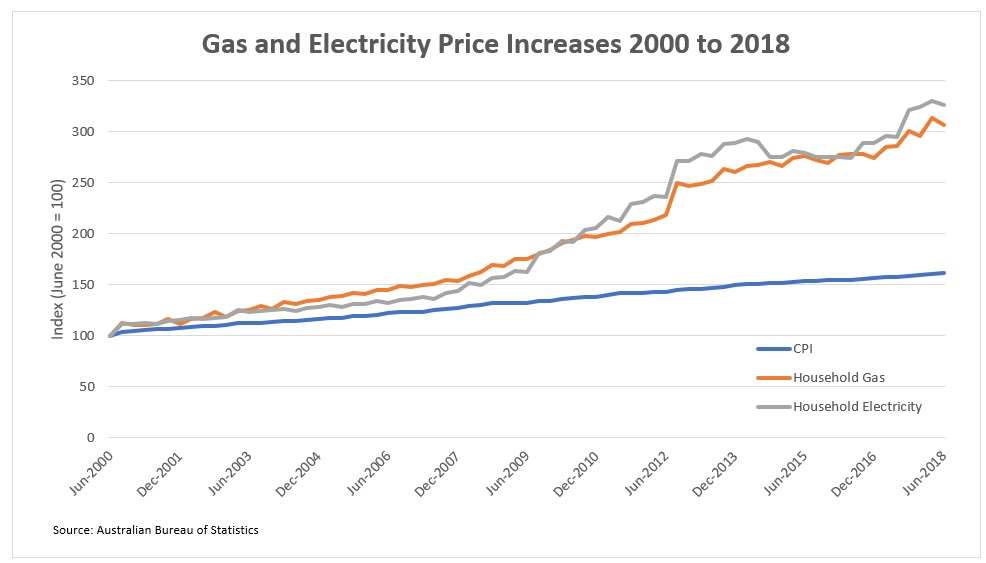
The above chart shows household gas and electricity prices in Australia and compares them to inflation. Using June 2000 as the baseline year, the CPI [Consumer price index which measures the prices paid by consumers for a basket of goods and services including energy] has risen by 61%. Over this same period, electricity has risen by +226% and natural gas by +207%.  As you will note from the above chart, energy price rises roughly matched inflation up until 2008, however energy prices have accelerated in relation to CPI particularly since 2012. It is worth noting that electricity prices are influenced by natural gas prices in that gas is used in gas-fired power peaker plants that can be fired up in response to peak periods of electricity demand.

 Gas Prices Up – a new source of demand

Due to the size of the Australian continent and the absence of pipelines linking the major fields off the coast of WA with Eastern Australia, gas prices are greatly influenced by geography. As you can observe from the below table, due to the lack of physical infrastructure WA’s gas from the giant offshore LNG fields is sold to consumers in Seoul and Tokyo rather than Sydney and Melbourne.
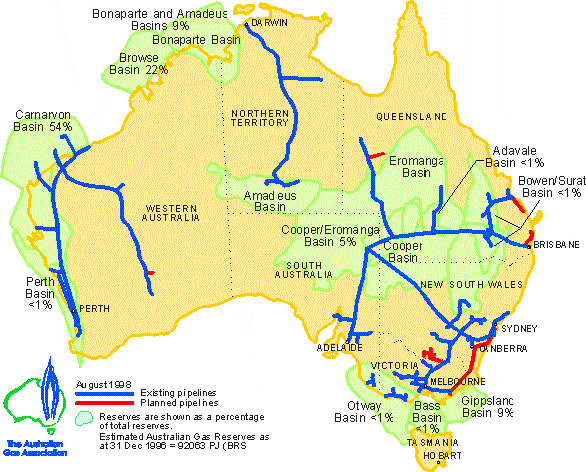
Until the construction of the construction of three liquefied natural gas (LNG where natural gas is cooled to -161 C to allow transportation) in the last five years, producers of natural gas on the East Coast of Australia could only sell their gas into the East Coast domestic market. This resulted in gas being priced below world prices for East Coast consumers. For example, in 2008 the wholesale price of 1 gigajoule of natural gas was $15 in WA versus $5 in NSW. The opening of these three export LNG plants in Gladstone in Queensland by Origin Energy, Santos and BG in 2015 and 2015 allowed the export of natural gas from  Eastern Australia to Northern Asian customers that were willing to pay over $10 per gigajoule.

Additionally, unlike in WA which mandates that 15% of gas produced in the state is reserved for domestic consumers, no such gas reservation scheme was enacted on the East Coast of Australia. AGL’s plan to construct an LNG import terminal by 2020 to serve the Victorian gas market will further link the prices that Australian consumers pay for natural gas to the world market, with gas expected to be imported from the USA and Qatar.

Consequently, with a new source of demand for natural gas being introduced and East Coast gas markets opened up to world prices, domestic prices naturally gravitated towards the higher export price. The construction of these three LNG export terminals has not only had negative consequences for consumers but due to the elevated construction costs of around $71 billion have also been a burden for shareholders with returns below expectations.

Gas Prices Up – new sources of supply halted

At the same time that demand for natural gas was increasing, a range of decisions were made by governments in NSW and Victoria to restrict new supply. Arguing about the benefits and harms of coal seam gas is beyond the scope of this piece, but economics dictates that if demand is going up and supply is unchanged, prices will naturally rise. In 2012 Victoria imposed a moratorium on coal seam gas exploration and in 2015 the NSW government banned new gas exploration. This saw AGL announce that it would not proceed with their projects in NSW and that they would be relinquishing their exploration licences. This action contributed to the energy company recording an impairment charge of $640 million in 2016.  We note that in April 2018 the Northern Territory reversed its ban on gas exploration outside towns and conservation areas in a move designed to put downward pressure on power bills.

Generation Costs Up – changing the mix and reducing supply

In the electricity market prices have been driven higher by the Federal Government’s Renewable Energy Target. This will require electricity retailers to acquire a fixed proportion of their electricity from renewable sources and is likely to result in  33,000 GWh of Australia’s electricity coming from renewable sources by 2020. Politicians seem surprised that regulations have added to electricity costs, following the closure of coal-fired base-load power stations in favour of more expensive renewables. For example, in 2017 Energie closed the Hazelwood power station that had previously supplied up to a quarter of Victoria’s electricity and AGL have announced that they will be closing the 1,680-megawatt Liddell coal-fired plant in 2022. Whilst we recognise that burning coal to generate electricity releases carbon into the atmosphere contributing to global warming, it is also a very cheap and consistent method of generating electricity. Additionally, coal-fired power plants are well-placed to provide a base-load of consistent generation, as these plans can generate electricity continuously, without requiring the wind to blow or the sun to shine.

Until the battery storage technology catches up to allow generators to store significant amounts of electricity, relying on solar and wind power generation requires natural gas-fired generation to step in to maintain consistent supply. As discussed above, this source of electricity generation is more expensive today that it was 10 years ago. Switching power generation to renewables – whilst socially desirable – comes at a cost, and this is reflected in higher energy bills. Further, in any market when supply is removed and demand remains relatively constant, prices tend to rise. This effect has proven profitable for incumbents who have generators, such as AGL Energy.

Our Take

Rising energy costs have impacted consumers and industrial users alike, but they have not arisen in a policy vacuum nor as part of a conspiracy. We see that they are the logical outcome of decisions that have changed the supply and demand for energy and that various companies have predicably acted to generate profit from these shifts. In the Atlas equity portfolio, we own positions in AGL Energy and Spark Infrastructure, both of which have benefited from changes in the energy markets in Australia over the past ten years. Neither of these companies is involved in the LNG export terminals that at this stage look to be a poor investment for shareholders.

What we have learned from reporting season

During the months of February and August every year, the majority of Australian listed companies reveal their profit results and most provide guidance as to how they expect their businesses to perform in the upcoming year. For fund managers, this is somewhat like Christmas, in that opening company results are like gift-wrapped presents: tearing the wrapping off starts to prove or disprove your reasons for owning a company.

In this piece, we will run through the key themes that have emerged over the August reporting season, the winners and the losers amongst Australia’s listed companies, and how our companies have performed.


Volatile price action on the day of the results

On the day of the result over the last month, we observed more over-reactions to profit results (both positive and negative) than usual.  We see that this occurs as the market price on the day of a company’s result is generally set by the short-term holders (i.e. hedge funds) and very short-term holders (i.e. machines) of equities, rather than the more measured long-term investors. Often the short-term investors trade with reference to whether a company misses or exceeds their expected earnings, rather than the drivers behind a company’s profits. For example, global packaging company Amcor fell -3.5% on the day of their result, which was weaker than expected due to higher resin prices. Whilst the market priced Amcor as if these headwinds were permanent, the nature of Amcor’s contracts with their customers means that rising raw material costs are passed on, albeit with a lag of several months. Conversely, construction company CIMIC (which we also own in the portfolio) had a good result that was above expectations, but probably not deserving of the +17% gain on the day of the result.When thinking about the noise that we face as investors, a great quote from Ben Graham, one of the titans of investing, comes to mind: “In the short run, the market is a voting machine but in the long run, it is a weighing machine.” Short-term prices are dominated by sentiment and short-term holders, but in the long term, share price growth is delivered by those companies that can constantly grow dividends flowing into their shareholder’s bank accounts.

Comparison to 2017 and a look ahead

The August 2018 results season was in aggregate better than expected for Australian listed companies, which reported on average earnings growth of 8% for the 2018 financial year. However, there was a large degree of variation amongst the different companies, with earnings growth in the miners (courtesy of higher commodity prices and a falling AUD) offsetting stagnant earnings growth in the financials. Having listened to close to eighty management presentations over the past four weeks, the general tone feels more cautious than it was in February or August last year. Companies with global exposure were concerned about inflation and the impact of a trade war between the US and China, whereas companies that are exposed to the domestic economy spoke about increasing political uncertainty and the potential for radical policy changes that may result from a change in government in mid-2019.

Market favourites did well 

One of the key themes coming out of this reporting season was that, unlike in the February 2018 reporting season, high price to earnings (PE) stocks that are well-regarded by the market mostly lived up or exceeded high expectations and their shareholders were rewarded. Polarising pizza company Domino’s Pizza (+9%) and JB Hi-Fi (+12%) both saw the short interest in their companies increase in the lead up to reporting their results, which ended up being better than expected. Similarly, a2Milk (+20%), Xero (+19%), ResMed (+10%) and CSL (+16%) all were expected to deliver very strong profit growth and did not disappoint.  The exception to this group was Flight Centre (-14%) which was sold off despite growing profits by +17%.

Give me my money back

Capital management was again a prevalent factor in the recent reporting season and was understandably of interest to investors. A number of companies increased their dividends above expectations, including AGL Energy, Qantas, Magellan and Fortescue. Additionally, we saw a few companies announce special dividends; Suncorp, Woolworths and IAG which was well received by investors with the exception of IAG due to concerns about the outlook for 2019.Rio Tinto, BlueScope Steel, Janus Henderson, Qantas and Crown all announced buy-backs, which should support their share prices over the coming months. Bucking this trend of returning capital to shareholders, Transurban announced a $4.8 billion capital raising to help fund their share of Sydney’s WestConnex motorway, and Harvey Norman raised $164 million to reduce debt on their balance sheet.
Whilst buy-backs boost share prices in the short term, in the longer-term companies do need to retain cash to reinvest in their operations in order to grow earnings in the future without adding to debt.

Cost inflation

Rising costs was a common thread through this reporting season, with most companies mentioning rising costs in their results commentary. Higher labour costs were cited by resource companies Rio Tinto and Alumina, which took some of the shine off otherwise solid results as investors extrapolated the impact of rising costs and falling commodity prices over the near term. Unsurprisingly packaging companies Amcor, Pact and Orora all felt the impact of higher resin prices, though these additional costs are expected to be recovered via pass-through contracts to their customers in 2019. Qantas saw an additional $690 million in costs from rising jet fuel prices, so travellers can expect the company to recover this via higher fares over the next year.Rising energy prices delivered AGL Energy a record annual profit of over $1 billion which allowed the company to increase its dividend by 29%. Whilst this was positive for AGL shareholders, large electricity users such as the office and shopping centre owners GPT and SCA Property faced higher energy bills.

Best and worst results

Over the month the best results were delivered by A2Milk (+20%), Magellan (+17%) and CSL (+16%) The key theme amongst this diverse group of companies all in different industries was a strong profit result and expanding profit margins combined with a positive outlook for 2019. QBE Insurance’s (+11%) shareholders were rewarded when the insurance company produced a result absent of negative surprises the market has come to expect from this stock.On the negative side of the ledger Origin Energy (-19%), Iluka (-18%), Ansell (-12%) and Challenger (-12%) all reported disappointing results compared with other companies. The common themes amongst this group were the profit results coming in below expectations combined with bearish management commentary for the coming year, mainly due to higher costs.

How we fared

Overall, we were reasonably pleased with the results from this reporting season for the Atlas Concentrated Australian Equity Portfolio.  As the Atlas High Income Property Fund focuses on owning conservative Trusts that are rent-collectors, reporting season offers few surprises especially as most of the Trusts we own pre-announced the distributions several months ago in June. Positions in Amcor, Pact and Flight Centre were offset by strong results from CSL, Wesfarmers, JB Hi-Fi and QBE Insurance.

As a long-term investor that is interested in delivering income in the portfolio to investors, something we look closely at is the dividends paid out by the companies that we own and whether or not they are growing. Following the great quote from Ben Graham mentioned above, we look to “weigh” the dividends that our investors will receive, as we view that talk and guidance from management is often cheap, but physically paying out higher dividends is a far better indicator that a business is performing well. Using a weighted average, the dividends that our investors will receive will be +11% greater than for the previous period in 2017.  Using this measure, we are pretty happy with how the recent reporting season went.

The most (and the least) profitable companies on the ASX200

In early May the major Australian banks collectively reported profits for their last six months of A$15.3 billion dollars. This resulted in some media commentary about banks being too profitable, especially as three of the banks reported in the middle of the Royal Commission into the financial services industry, which had highlighted examples of inappropriate financial advice and problems issues with lending standards.

Whilst large corporations generate large profits in dollar terms, what is often ignored in much of the debate on corporate profitability is that these profits have to be shared amongst millions of individual shareholders.

For example, collectively the banks made $15.3 billion, however, divided by 10.8 billion bank shares outstanding this crude measure equates to a mere $1.42 per share. In this piece we are going to look at different measures of corporate profitability for large Australian listed companies, looking beyond the billion dollar headline figure.

Different Measures of Profitability

As a fund manager, the $4.25 billion of cash profit generated by Westpac over the past six months does not mean very much. As an investor, I am most concerned with the underlying earnings per share (EPS), which is what the owner of a single share of the company receives from the profit generated in a particular year. In Westpac’s case, their cash earnings per share compared with the first half of 2017 grew 4.3% to $1.25 – nice growth but not particularly exciting.

We also look at growth in EPS, as often a company’s profits can grow substantially when they make an acquisition. However, if that acquisition is funded by issuing a large number of additional shares, profit per share might not actually grow. Conversely, a company’s profits may be down, but if this is due to the selling of a non-core division it could be a good result for shareholders. For example, earlier this month ANZ Bank reported a 16% decline in cash profits due to the sale of their Asian retail banking businesses. As the proceeds from the sales were used to buy back ANZ Bank shares, their earnings per share actually gained 4%. Additionally, at a company level, we also look at measures such as returns and profit margins, which can be better measures of how efficient a company’s management team is in generating their annual profits. Furthermore, these measures allow the investor to compare different companies in similar industries.

Return on Capital Employed

Return on Capital Employed (ROCE) looks at the profit generated both by the capital that the equity holders have contributed to establish the business, as well as the debt taken on to support the business’ activities.

ROCE is calculated by dividing a company’s profit before interest and taxes by the shareholders’ equity plus debt. The investment by shareholders includes both original share capital from the IPO plus retained earnings.

Retained earnings are the profits kept by the company in excess of dividends and are used to fund capital expenditure either to maintain or to grow the company. Companies with high ROCE typically require little in the way of equity to keep the business running and little need to borrow from their bankers.

The above chart shows the top and bottom companies in the ASX as ranked by ROCE. The top ROCE earners include:

  • a milk company (A2M),
  • three fund managers (Magellan, Perpetual and Pendal),
  • a healthcare company (Cochlear), as well as
  • an internet services companies (REA and Carsales).

The common factor in these businesses is minimal ongoing capital expenditure to run the company.

Bringing up the rear are a range of capital-heavy businesses that require both large amounts of initial capital to start the business and regular capital expenditure to maintain the quality of their assets and finance their ongoing activities. This subset includes a gain handler (Graincorp), logistics (Qube), retailer (Myer), healthcare companies (Healthscope and Primary), and an energy company (Santos). Typically when looking at this measure, miners, steelmakers, wineries and Qantas are prominently featured amongst the lowest returning businesses as they are operating in capital-hungry industries. However, in 2018 these three industries are currently enjoying cyclically strong earnings.

Profit margin

Profit margin is calculated by dividing operating profits by revenues. It measures the percentage of each dollar received by a company that results in profit to shareholders. Here we have used earnings before interest, taxes and depreciation as it allows us to compare companies across different industries with different capital structures, and this margin is for the six months ending December 2017.

Typically low margin businesses operate in highly competitive mature industries. The absolute profit margin is not always what investors should look at when analysing a company’s results, but rather a change in this margin. A rising profit margin may indicate a company enjoying operating leverage as profits are growing at a faster rate than costs. Conversely, a declining profit margin could indicate stress and might point to large future declines in profits.

From the above chart, the highest profit margins are generated by companies that are fund managers enjoying the operating leverage mentioned above (Platinum and Magellan), monopolies (ASX), internet businesses (REA), or energy companies (Woodside and Oilsearch).

The energy companies enjoy a high-profit margin, as once the large offshore LNG trains are built these assets have a low marginal cost of production per barrel of oil. Obviously, this metric does not account for the tens of billions in capital required to build these giant projects. BHP features in this list courtesy of the 60% profit margin that the Big Australian earns from digging up iron ore in the Pilbara when iron ore prices are around US$70 per tonne. Low profit margin companies characteristically receive large revenues but operate in intensely competitive industries such as petrol retailing (Caltex), grocery retailing (Metcash, Woolworths and Wesfarmers), department store (Myer), and construction (Lend Lease).

Companies with low profit margins are obviously forced to concentrate closely on preventing their profit margins from slipping, as a small change in their margins is likely to have a significant impact on the profit available for distribution to shareholders. For example Metcash’s food distribution business runs on a very slim profit margin, such that when the business faced declining margins in 2014 they were forced to cut their dividend, which was not reinstated until 2017. For this reason, we monitor the net interest margins of the banks very closely

Our take

While the banks and the large miners (BHP and RIO) generate large absolute profits resulting in headlines around the billions of dollars they earn, they are generally not among the most profitable large listed Australian companies in terms of profit margins and returns on assets. Over the last six months, Commonwealth Bank’s 48,900 employees produced a $4.7 billion profit, but this represented a return on assets of 1.03% and a profit or net interest margin of only 2.16% on a loan book of $962 billion. When looking at companies to include in the Maxim Atlas Core Australian Equity Portfolio, the indicators of earnings power that we look at is not the headline number, but rather its return on capital or equity and changes in profit margins.

Monthly Newsletter December 2017

  • The Fund posted a gain of +0.6% over the last month of 2017, ahead of the underlying ASX 200 A-REIT index. December was dominated by the news of the potential takeover of Westfield by Unibail-Rodamco. Outside of Westfield, the overall performance of the index was weak.
  • The Fund remains positioned towards Trusts that offer recurring earnings streams from rental income rather than development profits, we see that this is likely to position us well going into 2018, as the property development market cools.
  • In December the Fund paid a distribution of $0.05; an increase of +2.9% over the September quarter distribution.


Go to  Monthly Newsletters for a more detailed discussion of the listed property market in December and the fund’s strategy going into 2018.

Dogs of the ASX …. Woof Woof!

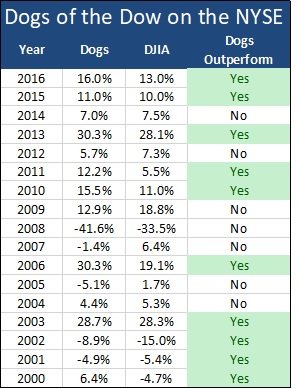
The “Dogs of the Dow” is an investment strategy that is based on buying the ten worst performing stocks over the past 12 months from the Dow Jones Industrial Average (DJIA) at the beginning of the year, but restricting the stocks selected to those that are still paying a dividend. The thought process behind requiring a company to pay a dividend  is that if it is still paying a distribution, its business model is unlikely to be permanently broken. The strategy then holds these ten stocks over the calendar year and sells them stocks at the end of December. The process then restarts, buying the ten worst performers from the year that has just finished. In this area retail investors can have an advantage over institutional investors, many of whom sell the “dogs” in their portfolio towards the end of the year as part of “window dressing” their portfolio. This avoids the manager having to explain to asset consultants why these unloved stocks are still in their portfolios.

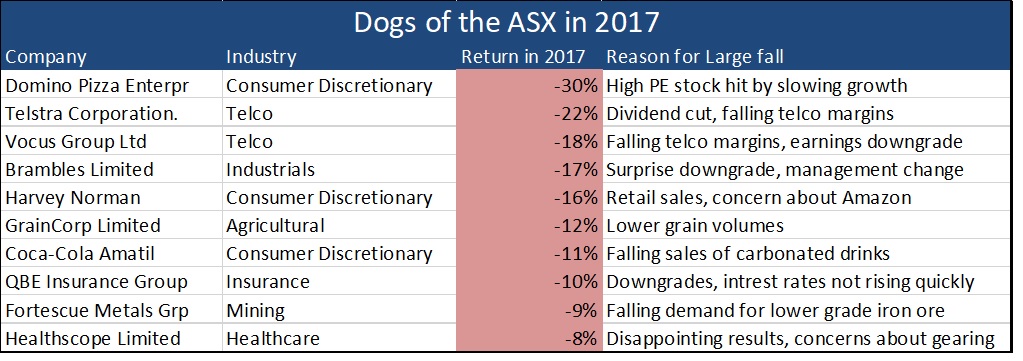
In this week’s piece written from snowy Norway,  we are going to look at the “dogs” of the ASX, focusing on large capitalisation Australian companies with falling share prices. Additionally, we are going to sift through the trash of 2017 to try to discern any fallen angels with potential to outperform in 2018.   Unloved mutts
The Dogs of the Dow was made famous by O’Higgins in his 1991 book “Beating the Dow” and seeks to invest in the same manner as deep value and contrarian investors do. Namely, invest in companies that are currently being ignored or even hated by the market; but because they are included in a large capitalisation index like the DJIA or ASX 100, these companies are unlikely to be permanently broken. They may have the financial strength or understanding capital providers (shareholders and banks) that can provide additional capital to allow the company to recover over time.

ASX Dogs over the past five years
The table below looks at both the top and bottom performers for the past five calendar years and their performance over the subsequent 12 months. As always this is measured on a total return basis, which looks at the capital gain or loss after adding in dividends received.  Whilst sifting through the trash at the end of the year yields the occasional gem – such as Qantas in 2017 (+65%), Fortescue in 2016 (+223%), Qantas again in 2014 and Challenger in 2012 (+81%) – an equal weighted portfolio of the dogs of the ASX 100 has outperformed the index in three of the past seven years.


Themes
Looking at the above table, finding the fallen angel among the worst performers seems to work best where the underperformance is due to stock-specific issues, rather than macro issues beyond a company’s control. For example, Cochlear underperformed in 2013 after weaker sales as the company waited for approval to sell its new Nucleus 6 product in the United States. Subsequently, Cochlear’s share price has gained 240%,  as hearing implant sales bounced back. Similarly BlueScope Steel had a tough 2015, which saw the company seeking government support to help restructure their Port Kemba steelworks. Concurrently, cheap Chinese steel took market share at the same time as key inputs of iron ore and metallurgical coal were climbing upwards. 2016 saw a significant turnaround for BlueScope’s shares which gained +111% as profits recovered due to cost controls, stronger sales and the benefits of an acquisition in the United States.

The common factor among the underperformers that have continued their slide in the following year is when the underperformance is tied to factors outside the company’s control, such as a multi-year decline in a commodity. From the list of underperformers in 2014, continuing declines in iron ore delivered further pain to Arrium, Fortescue and BHP’s shareholders. Similarly, a several year slide in oil prices pushed down the share prices of Santos and Worley in the subsequent 12 months.

Unloved hounds as of December 2017
As a fund manager the key question is whether there are potential show champions in the breed of unloved canines tabled below for the 2017 calendar year. Unlike previous years a diverse mix of sectors are represented and there are more company-specific reasons for underperformance, which should yield more opportunities to pick some treasure out of the trash.

Looking at the two telcos Vocus and Telstra, it is tough to see the near term catalysts that will transform them into stars in 2018, with the NBN market likely to remain intensely competitive with high costs to migrate customers. Fortescue is likely to continue to face Chinese preference for higher grade iron ore over its lower-grade blends to improve furnace efficiency and reduce pollution. Domino’s Pizza could be a candidate for a turn-around in 2018, now the company is more reasonably valued with multiple avenues for growth across its discount pizza operations in Europe, Australia and Japan and a falling AUD will boost earnings. Similarly Brambles could see a brighter 2018 based on growth in US pallets, management stability and a falling AUD.


Our View
Whilst the Dogs of the Dow might work in a market populated with a diversified range of companies in uncorrelated industries such as McDonalds, 3M, Merck and Microsoft, it does not appear to be a broad strategy that one can use consistently in the ASX. We see that among the companies in the ASX 100, the composition of the index is not as broad as the Dow at an industry level. The ASX has a high weighting to resource companies, whose profitability is largely tied to commodity prices (such as oil and iron ore) that are outside of management’s control and can be subject to multi-year declines.

Nevertheless it can pay to sort though the dogs of the ASX. From the table above over the past 5 years, one of the top performers in the following year can be found by sifting through the dogs of the ASX100.