The little Aussie Battler under pressure

In the press, large movements in the Australian dollar are often erroneously presented in the press as a vote of confidence in Australia as a nation or the management (or mismanagement) of our elected leaders. A falling Australian dollar is often viewed as a negative event, raising the cost of online purchases, imported cars and overseas travel.

Over the last year, we have seen the AUD fall 8% vs the USD, continuing the volatility in the AUD that we have seen over the past decade since the AUD peaked at 1.10 vs USD in 2011. Over 2018 we had seen the AUD slide downwards from a peak of 0.81 in January to 0.725 as uncertainties over the leadership of the country have increased. Political instability is likely to continue to weigh on the AUD in the short to medium term, as over the next year Australia faces a National election and a likely change in government to a party that has few business or investor-friendly policies.

In this week’s piece we are going to look at currencies, the AUD and in particular the winners and losers from currency movements.


Fixed Rates

For much of the last 200 years currencies have been fixed either against another stronger currency or commodity such as gold. For example, following the second war the Bretton Woods agreement pegged currencies against the USD, which was fixed to gold at the rate of US$35 per ounce.

When a country has a fixed currency and faces adverse economic conditions, their treasury inevitably uses the nation’s stock of foreign currency reserves to prop up a faltering exchange rate. The outflow of foreign currency reserves occurs as investors seek to exit and sell the county’s currency which is viewed as overpriced based on the changing economic circumstances or market sentiment.  A great example of this occurred in Russia in 2008, which saw Russia chew through US$200 billion in carefully hoarded foreign currency reserves in a futile attempt to defend the value of the rouble before eventually devaluing the exchange rate.

Additionally, fixed rates can attract the attention of speculators that may look to profit from a forced reset in the exchange rate, where the rate is perceived to be fixed at a rate higher than the currency’s fundamentals. For example, in 1992 the GBP was set at a rate of 2.7 DM to the GBP as part of the European Rate Mechanism, fundamentally this over-valued the GBP as it the UK’s inflation rate was three times that of Germany’s. Speculators famously led by George Soros shorted the GBP, after spending large amounts of foreign currency reserves defending the GBP and raising interest rates from 10 to 12%, the GBP was ultimately devalued, netting Soros’ fund a profit of GBP1 billion.

Floating Rates

In the 1970s as a result of inflation induced by spending in on the Vietnam war, the US abandoned fixing the USD to gold and allowed the USD to float freely in line with market demand. The free float of the USD eventually forced other major currencies to follow suit, with the AUD switching to a floating rate in 1983.

By allowing its currency to float freely, a country loses the ability to control its exchange rate, but it gains control of its monetary system. Before 2000 (when the Greek Drachma was fixed to the €), the current Greek debt situation would have arguably been much less painful to the Greek economy. The current Greek debt crisis would have seen the Drachma being sold down heavily, thus making summer holidays on the Aegean and Greek olive oil much cheaper than similar products offered by Italy or France.

History of the AUD

In 1983 when the Hawke government came into power, one of their first decisions was devalued the AUD by 10% and float the Australian dollar, assuming that this action would cause the AUD to fall and improve our international competitiveness and stimulate the export sector. Before 1983, the value of the AUD was set each day by the Reserve Bank of Australia (RBA) and the Federal Government and either directly pegged to the foreign currencies such as the GBP or USD or pegged to a trade-weighted basket of currencies.

Corporations had to apply to the RBA to buy foreign currencies to buy imported goods or make investments offshore, with the RBA selling the company USD or GBP in exchange for their AUD at the official fixed rate.

Two floors of the RBA Building in Martin Place were occupied by Exchange Control staff whose job was to make it hard and discouraged for Australian businesses and investors wanting to invest offshore. While this sounds archaic, this level bureaucratic obstruction may have prevented BHP US shale gas debacle or Wesfarmers UK hardware expedition, both of which resulted in significant transfers of wealth from Australian shareholders to companies domiciled in the US and the UK.


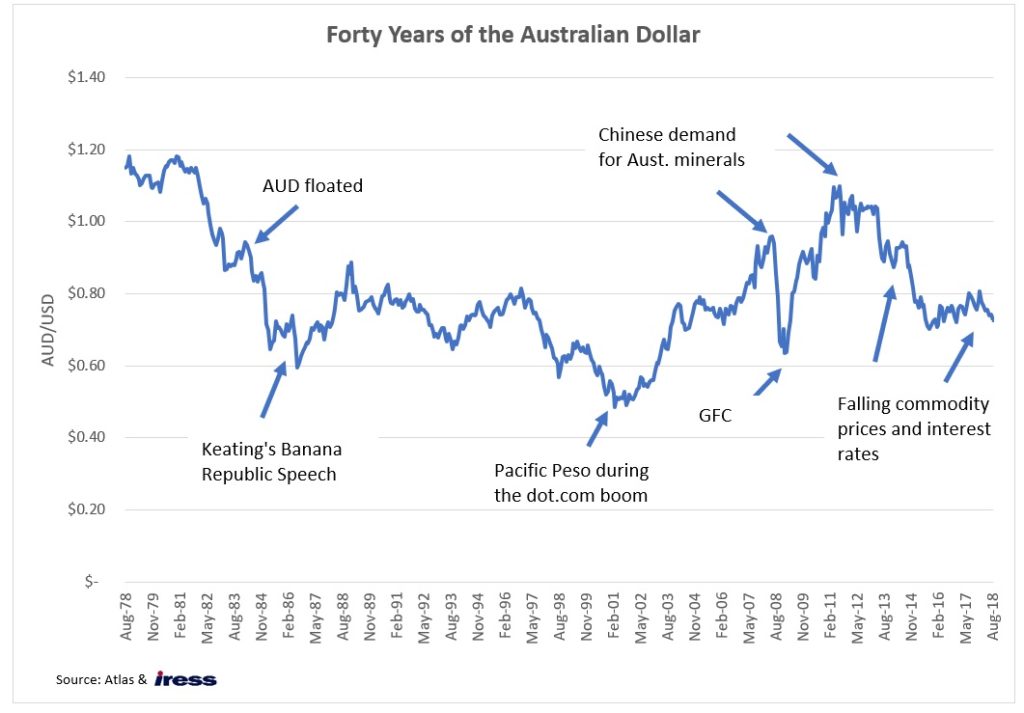
Since floating in 1983 the AUD/USD has averaged 76c. However, the AUD was in a downward trajectory from 1983 to 2002. This was broadly due to Australia’s higher relative inflation rate. The strength in the AUD over the past ten years has been a result of China’s industrialisation and its unprecedented associated explosion in demand for Australian minerals since China’s integration into the global economy after joining the World Trade Organisation in 2001. More recently the interest rate differential between Australia and the US and Europe has boosted the AUD; though rate cuts since 2011 and higher US rates have closed this gap. In the medium term, we would expect the AUD to move towards fair value based on purchasing power parity, which we estimate, is approximately US$0.66.

WINNERS

The companies that are likely to benefit from a weaker AUD fall into four categories;

  1. Import substitution:  Companies that produce something in Australia and compete with the now more expensive imports such as steel (BlueScope), fertiliser (Incitec Pivot) or tourism (Crown).
  2. Exporters: Companies that have production costs such as wages in Australian dollars but sell a commodity globally like iron ore that is priced in USD (Rio Tinto) or Grange Hermitage wine (Treasury Group). Here a falling AUD translates into higher revenue for the same quantity of goods sold.
  3. Companies with inflation linked-pricing: When a falling AUD results in inflation, companies like Transurban should see an expanding profit margin. Here their road tolls will increase with inflation, while a proportion of these companies’ costs remain fixed, thus resulting in higher profits.
  4. Offshore Operations: The falling AUD also benefits companies with substantial offshore operations such as CSL, Atlas Arteria and Unibal-Rodamco-Westfield, as their USD or Euro denominated earnings are worth more when translated back into AUD for Australian investors.

Losers

The companies that are likely to hurt from a weaker AUD fall into three categories;

  1. Resellers: The companies that are typically hurt by a falling AUD are those that buy goods offshore for resale to Australian consumers such as retailers Myer and JB Hi-Fi.  Here Australian consumers wages are not impacted by a fall in the currency, but a new iPhone or LED TV’s cost has gone up.
  2. Users of foreign content in their production process: Similarly, a falling AUD presents a challenge for companies like Qantas and Seven West Media that earn revenue in AUD from domestic consumers, but have significant USD-denominated costs such as aviation gas or television series produced in the USA.
  3. Unhedged borrowers of offshore debt:  Further, companies that have significant un-hedged USD borrowings such as Boral will see their interest costs increase, especially if the company does not have USD earnings to service their debt. This situation occurred in 2010 and required Boral to raise $490 million to keep the company within their debt covenants.

Our Take

We expect the AUD to continue to trend down towards 66c in-line with purchasing power parity, diminishing interest rate differentials between Australian and other Western economies and expected further falls in commodity prices. Accordingly, we have structured the portfolio to benefit from a falling AUD. One additional benefit in having a strong bias towards companies with earnings offshore is that the variability of domestic political decisions and the uncertainty brought on the turnover in leadership will have less of an impact on profits and dividends.

Losing money overseas

In the travel sections of newspapers there frequently appear articles with titles such as Top 7 Overseas Travel Scams (and How to Avoid Them). However, Atlas see the biggest cause of Australians losing money overseas is not pickpockets, dodgy taxi drivers, or pre-damaged jet skis, but rather ill-conceived offshore acquisitions by Australian corporates.

Last Friday the latest of these came to an end with Wesfarmers exiting their UK Hardware operations. Over the two and a half years of ownership, this adventure cost Wesfarmers shareholders A$1.7 billion. What is worse is that for shareholders of Wesfarmers, booking the loss and selling these operations for one pound is a good outcome as it avoids significant closure costs. At Atlas, based on bitter experience we are very sceptical about offshore acquisition strategies embarked on by Australian corporates. In this week’s piece, we are going to look at offshore expansion by Australian companies.


Why Australian companies expand offshore

The main reason expounded by Australian corporates for offshore expansion is to gain access to larger pools of potential customers for the purpose of driving earnings growth. In many industries, Australian companies operate in oligopolies or are constrained by government regulators such as the ACCC (Australian Competition & Consumer Commission) from growing rapidly through either price competition or acquiring competitors.

In the banking or grocery industries, neither Westpac nor Woolworths are able to take market share from competitors by dropping prices, as their competitors will immediately match their moves. Similarly, a move by Westpac to acquire the smaller Bank of Queensland would have difficulty getting approval from the ACCC.

Other reasons touted for global expansion are access to new technologies and diversification, since business or regulatory conditions in certain foreign markets may not be correlated with those in Australia. For example, Sonic Healthcare is not likely to face simultaneous fee pressures in their pathology businesses in the USA, Australia and Germany. Where management teams are under pressure and incentivised to grow earnings each year, it is understandable that they could be seduced by an investment banker in a two-thousand-dollar suit selling dreams of global expansion.

We will now go on to examine some of the mistaken assumptions that motivate international expansions.

Wrong move 1: We are dominant in Australia, so we will dominate the world

We see that this is the most common mistaken assumption made by Australian corporates venturing offshore. Arguably this was the rationale motivating Wesfarmers when they purchased the number two player in the UK hardware market in 2016. In Australia, Bunnings dominates the $48-billion hardware sector and earns an EBIT margin of 14%, whereas Bunnings’ equivalent in the UK – Kingfisher – has an EBIT margin of 7% in a more competitive and crowded market. Firstly, Australian entrants will often face higher levels of competition in new markets. Furthermore, a successful strategy in Australia will not necessarily resonate with foreign consumers. In the case of Bunnings UK, large BBQs and cheap power tools that sell in Sydney were a surprise to UK shoppers entering a Homebase store in the UK looking for Laura Ashley homewares.

Other examples of this factor can be seen in IAG’s entry into the UK general insurance market after buying the country’s eighth largest motor insurer. Ultimately this adventure cost shareholders $1.3 billion, as IAG found the UK insurance market far more competitive than Australia where IAG, Suncorp and QBE have a 70% market share.  In a similar vein, NAB in the late 1980s and 1990s acquired banks in Northern England, Ireland and the USA, based on the strategy that their dominance in Australia would translate into other parts of the English-speaking world. Ultimately NAB was unable to run the dispersed set of financial services businesses from Melbourne and this adventure cost shareholders billions, though it would have been costlier had NAB not sold their Irish banks to Denmark’s largest bank just prior to the GFC.

However, it would be disingenuous not to mention that foreign companies also make this same mistake in buying domestic assets at high prices off canny Australians. Japan’s Kirin Breweries and UK’s SAB Miller have written off portions of the Lion Nathan and Fosters brewing assets, as sales of iconic Australian beers such as Tooheys and Victoria Bitter have declined with drinkers turning to smaller craft beers.

Wrong move 2: Let’s try something new

This version of an offshore misstep generally occurs when an Australian corporate with excess cash is presented with an opportunity to grow earnings by investing in a new technology in a foreign market. Typically, this involves buying assets from local players who typically have a better grasp on what the assets are actually worth. A great example of “Let’s try something new” has been BHP’s investments in US onshore shale gas in 2011 and 2012. BHP acquired assets of US$4.75 billion from Chesapeake, and US$15 billion for Petrohawk. BHP at the time was flush with cash due to a surging iron ore price. However, extracting shale gas in the US is more of a small scale modular process compared with BHP’s massive iron-ore and offshore LNG projects. Furthermore, BHP’s purchase was made at peak oil prices. In 2018 BHP is in the process of extricating themselves from these acquisitions, having already written off US$13 billion of this investment.

 Wrong move 3: Sort of similar to something we already do

This acquisition mistake is a close cousin of “let’s try something new” in that the acquisition is made in an area close to the company’s core area of competency and presented to investors as a low-risk form of offshore expansion.  Fletcher Building’s purchase of the Cincinnati-based Formica in 2007 for US$ 700 million from private equity was touted as a logical extension to the company’s decorative surface laminates business. In hindsight, this acquisition was made at the peak of the US housing construction cycle for a business that faced ongoing production issues due to site consolidation.

Slater+ Gordon’s acquisition of Qunidell’s professional services division in 2015 for A$1.2 billion also falls into the category of “Sort of similar to something we already do”. Whilst this infamous acquisition made Slater+Gordon the number one personal injury law firm in the UK, it also added claims management companies, insurers and insurance brokers – businesses somewhat adjacent to the company’s core litigation practice. Arguably this move helped contribute to equity holders losing 99% of the value of their investment in the company as it both burdened the company with too much debt and bought a business without undertaking sufficient due diligence.

Shortly after the purchase of Quindell, the UK government announced plans to limit the proceeds from personal injury claims and Quindell came under investigation for accounting practices that inflated earnings. See Jonathan Shapiro’s fine analysis of this transaction in Sowing the seeds of Slater & Gordon’s market demise.

No discussion of poor acquisitions would be complete without including Rio Tinto’s 2007 acquisition of Canada’s Alcan for US$38 billion, which manages to put tick most boxes of a poor offshore expansion. This acquisition arguably was made to fend off a takeover from BHP and led to Rio acquiring smelters in exotic places such as Iceland (“Sort of similar to something we already do”) and engineered products and packaging (“let’s try something new”). Ultimately US$30 billion of this acquisition was written off and resulted in a highly dilutive equity issue in 2009.

Offshore acquisitions that worked

It would be wrong to claim that all offshore acquisitions end in tears for Australian investors. A number of Australian companies have made major offshore acquisitions that have driven earnings growth for a number of years and propelled the company into a major global player in their industry. Amcor has leveraged a range of successful acquisitions to become one of the largest manufacturers of flexible packaging and rigid plastics, ironically making their most successful acquisition from Rio Tinto.

Similarly, CSL made major acquisitions in 2000 and 2004 in Switzerland and Germany and is now the largest global producer of blood plasma-derived medicines. Computershare has grown through acquisition to become one of the largest global share registry businesses, successfully buying and improving the profitability of various global banks’ unwanted registry businesses.  Sonic Healthcare has made 50 acquisitions over the past 20 years in Europe and the US. Sonic’s shareholders have enjoyed rising profits due to doctors requesting greater numbers of tests per patient and being able to run higher volumes through their increasingly automated labs.

The common theme through these successful offshore expansions is that the Australian companies have focused on a particular niche where the Australian company has some form of comparative advantage. This is very different from buying foreign banks, where the Australian company brings no intellectual capital or technology to the table, only capital!

Our take

Wesfarmers’ adventure into the UK hardware market is unlikely to be the end of Australian corporates making poor foreign acquisitions. Management teams are incentivised to grow earnings, and acquisitions are presented as a quick way to achieve this goal. Atlas is very wary of companies announcing major offshore acquisitions as for every successful acquisition there seem to be several that end in tears. The common theme is one of excessively optimistic due diligence which underestimated the level of competition in the new foreign markets and the difficulty in managing diverse global businesses from a head office in Sydney or Melbourne.

The Mining Cycle – Booms and Busts

Unlike industrial companies such as Amcor or Transurban, profits for mining companies are inherently cyclical. The  earnings from mining companies are subject to booms and busts, largely outside the control of their management teams. This occurs as ultimately any company producing a commodity is a “price taker” not a “price maker”,  as there is no difference or brand premium between a pound of copper mined in Australia or in Chile. Due to the nature of the cycle, we see that mining stocks should not be viewed as buy and hold forever. Rather, investors should pick and choose their entry points based on where they consider that minerals are in the mining cycle.

In this week’s piece we are going to look at the five different points of the mining cycle and where in the cycle Atlas perceive that commodities are currently positioned. The chart below shows the commodity cycles over the past 200 years, with the peaks coinciding with major wars or industrialisations of large economies.


1. Demand for commodities drives up prices
In the short term, supply is relatively fixed for most commodities as miners have optimised their mines for a specific level of production and minimal exploration during the lean times has run down ore reserves. At stage 1 of the cycle memories of the previous bust are still pretty fresh, and there is likely to be an under supply of personnel such as mining engineers. Additionally, the few surviving mining services businesses and contractors are likely to have minimal spare capacity which could allow production to expand quickly. Further, management teams in the mining companies are unwilling to greenlight capacity expansions until they become convinced that higher commodity prices are permanent.

In recent times this occurred in 2004 and 2005 as the industrialisation of China delivered a new buyer for Australian materials. This saw copper increase from $1 per lb in 2004 to close to $4 per lb in 2008 as supply was relatively static despite increased demand.

2. New Exploration undertaken to add to supply and Takeover activity surges

At stage 2 of the cycle, management teams at the mining companies are likely to be running existing mines at full capacity and have developed some confidence that elevated prices will persist for some time. This incentivises new exploration and capex is allocated to bring previously uneconomic discoveries into production.

At this stage we also see surging M&A as companies use excess capital built up in Stage 1 to buy growth which can be delivered faster through a takeover than developing new mines.  An example of this was the 2007 acquisition of Alcan by Rio Tinto for US$38 billion.

3. New mines start producing at the same time results in supply being greater than demand 

Due to the long lead times, in my observation a range of projects tend to hit the marketplace at almost the same time. Additionally, from speaking to resource CEOs during stage 3, each of them are invariably convinced that they have the best project and that rival projects won’t go ahead or get financing. Quite often a range of similar projects are all developed, with banks falling over themselves to provide finance them. Prior to stage 3 these projects look to be quite low risk with short payback times if prices are maintained (which they won’t be). Further, the costs of these projects are inevitably higher than originally forecasted due to the competition for scarce resources such as skilled labour and capital goods. A great example of this can be seen in the decision of Santos, Origin Energy and BG to construct three LNG gas projects simultaneously at Gladstone in Queensland.

The long lead times between development and first production can result in new mines coming online in market conditions quite different from when they were first conceived. A great example of this is Oz Minerals’ Prominent Hill Copper Mine which started being developed in 2006, and then came online 3 years later in 2009 at a cost of $1.2 billion. During the construction process the Copper price had fallen from $4 per lb to $2 per lb at the time of mine opening.  Similarly the US$10 billion Roy Hill iron ore mine started initial developments in 2011, with full production only being achieved in 2017.

Due to the debt burden generally incurred to develop projects, despite the fall in commodity prices at stage 3 of the cycle, many mines will boost production to cover their cash costs (including debt repayments), driving down industry margins. Given the cost of actually closing a mine (redundancies and break fees for contracts written with rail and equipment suppliers), most mining executives are reluctant to put their projects on care and maintenance to remove capacity from the industry. We saw this in 2014 and 2015 where a range of smaller Australian iron ore such as Atlas Iron and BC Iron were mining iron ore, yet were losing close to US$20 on every ton of their ore shipped, with the iron ore price at $50/t. Additionally, higher cost Chinese state-owned iron ore mines continued production despite losing money on every ton,  due to the perceived political imperative to maintain employment.

4. High cost and less efficient mines close and late cycle projects abandoned until next boom

At this stage of the cycle the canaries in the metaphorical coal mine are the contractors servicing the miners. In an effort to avoid the finality of shutting production, costs are pared back with the services businesses serving the mines the first to feel the pinch. Exploration budgets are slashed and expansion plans put on ice. These actions can push highly geared services companies such as Boart Longyear into administration. Larger mining services companies such as Downer tend to see large declines in profit as services are taken in-house by the miners and bull market contracts are re-written.

The next step at this stage is for the higher-cost producers to mothball their mines in an effort to conserve corporate cash and keep the company as a going concern. In 2015 a range of higher cost iron ore producers such as Atlas Iron, BC Iron, Arrium and Mount Gibson shut production, some of which have since been reopened. The more established mining companies at this stage will slash dividends (BHP in 2016) or raise capital to stave off worried bankers (RIO in 2009).

Complex late cycle projects that get deferred included Rio Tinto’s controversial Simandou iron ore project in Guinea which was shelved in 2016 due to concerns about the iron ore price. To develop this mine, Rio Tinto would have needed to construct both new 670-kilometre heavy freight rail line to transport iron ore shipments from Guinea’s Simandou Mountain range to the coastal city of Conakry and a sea port to load this ore onto ships. Despite the size and quality of this ore body, this would have been a risky and costly venture at this stage of the mining cycle.

5. Capitulation 

At this stage sustained falls in commodity prices forces a range of second and third tier miners into administration with ownership transferring from equity to debt-holders. The remaining lower cost miners going into survival mode, focusing in on conserving cash.  Exploration will stop, as excess supply is now expected to continue almost indefinitely.  Here a range of professionals such as mining engineers and resources analysts at investment banks will start to leave the industry.  The last part of this circle of life is the conversion of the ASX-listed shells of mining companies into “new economy” companies to speed up their listing process. For example, in the late 1990s the ASX-listed shells of the defunct mining and exploration companies from the 1980s  were reborn as “dot.com” companies.

Where are we now?

Every cycle broadly follows the curve, yet looks a little different when you are in the eye of the storm. Two years ago, in January 2016 it strongly appeared that we were in stage 4 and staring down the barrel of a long winter for commodities prices, but 2017 did not follow the expected script as commodities prices strengthened. This occurred due to China’s efforts to stimulate their property sector, slightly stronger growth in the developed world, and supply disruptions to mines such as Samarco in Brazil. Additionally, structural reforms in China aimed at reducing pollution and improving the quality of growth have increased demand for higher quality grades of commodities. 

The 2017 recovery in commodity prices has pushed us back into the mid cycle, though both companies and the investment community are very cautious. There are few new IPOs coming to market outside the exotic commodities linked to electric vehicles, minimal significant corporate takeovers being announced, and expansion activity remains subdued. In the upcoming February, reporting season will show very healthy mining company balance sheets which will hopefully result in improved returns for shareholders, rather than value destructive empire building. 

We are more cautious than most, as being pushed back into this favourable stage has occurred to some degree by the desire of the Chinese government to stimulate their property market. Chinese economic policies will not always favour Australian investors and a cooling Chinese property market (as breaks are applied) could have a chilling impact on commodity prices.