

Blog
February 2019 Reporting Season – Halfway Point

Whilst fund managers regularly meet with companies between reporting periods to gauge how their businesses are performing, during reporting season companies open up their books to allow investors a detailed look at the company’s financials. As company management
A dividend cut is ‘very much on the cards’ for NAB
Four key trends to drive property sector in 2019
Commentary on house prices was a major topic in Australia’s media throughout 2018. As a nation whose taxation system incentivises home ownership, falling prices – although coming off close to 10 years of solid annual compounding gains – understandably generate a large amount of media coverage and community interest.

Although house prices have been the main focus, real estate is not a homogenous asset. Indeed, the housing whose prices generate so much interest among the Australian public falls into only one of several real estate sectors. Looking across the property trusts listed on ASX, the assets owned are diverse and can be broken down into five distinct groups:
1. Large shopping centres (consumer discretionary retail)
2. Small neighbourhood centres (consumer staples retailing)
3. Office towers (office)
4. Housing and apartment developers (residential), and;
5. Manufacturing or distribution centres (industrial).
The assets in these real estate categories are likely to offer very different risks and returns for investors in 2019.
Common misconception
A common misconception among investors is that the $124-billion listed property index is primarily exposed to residential real estate. Residential property comprises a small proportion of the index, with only 4 per cent of the value of the index coming from trusts exposed to residential property.
Therefore, an A-REIT fund manager is unlikely to be in a position to provide a particularly informed response about where they think house prices in your suburb will go.
Further, residential exposure in property trusts comes primarily from developers selling finished apartments or home and land packages, such as Mirvac and Stockland, not from owning apartments that are rented out.
The property trust is therefore only minimally exposed to rising or falling housing prices. The skew towards development rather than investment in residential property occurs because there is more profit in developing and selling residential property to retail investors than there is in owning it.
Here are what Atlas consider to be the four trends in Australian listed property market for 2019:
1. Declining development profits
Over the past few years, one of the biggest drivers of profit growth in the listed property sector has been the growth in development profits. Typically, towards the end of a bull market in property, development profits grow rapidly.
This growth is driven by certain trusts selling surplus industrial land to optimistic residential developers at a profit. Trusts generate gains from selling completed assets – and indeed registered profits – by revaluing assets that are sold into wholesale funds managed on behalf of external investors by the property trust.
These non-recurring profits currently comprise a significant component of the earnings of A-REITs such as Goodman Group, Charter Hall and Mirvac.
In Atlas’ view, the market is currently pricing these trusts as if such profits were a permanent source of earnings for unitholders.
From 2008 to 2010, development profit generated by property trusts went to almost zero. We are not forecasting another GFC to occur in 2019, but it is hard to see development earnings being maintained at current levels in the face of a moderating real estate market in Australia.
2. Rising defaults
Over the next year, we will be looking closely at the level of defaults reported by trusts involved in residential property development. Of particular interest are developments where buyers have paid deposits (typically for apartments bought off the plan pre-construction) that are slated to finish construction in 2019.
A buyer may refuse to complete a sale if they have trouble obtaining finance, or the value of the property has declined after completion. In this situation, the buyer forfeits their 10 per cent deposit, but the owner of the development is forced to attempt to re-sell the apartment. Re-selling has the potential to reverse development profits earned.
Currently, defaults in the apartment market remain below 2 per cent. However, 2019 could see this figure rise as projects are completed where investors and owner-occupiers are taking delivery of a new apartment valued below what they have paid.
3. Impact of Amazon on retailing
In December 2017 Amazon announced its entry into the Australian market. The immediate impact was significant share price weakness for Australia’s shopping centre landlords, based on the view that the American e-commerce giant might turn the nation’s shopping centres into ghost towns. We also saw a range of weaker retailers go into administration.
However, changes to the tax code in July 2018 now require online retailers to collect GST on purchases below $1000. Subsequent to this partial erosion of Amazon’s advantages it has closed off its larger US online store to Australian consumers. Additionally, the pricing offered by Amazon on many goods was in line with what was being offered by bricks-and-mortar retailers such as JB Hi-Fi.
Looking through the recent quarterly updates from retail landlords, Australians are still going to shopping centres and opening their wallets. A-REITs with generally higher quality malls reported sales growth between 2 and 4 per cent in 2018, and the mood was far more upbeat than 12 months ago.
We have seen shopping centre landlords seeking to remix their portfolio of tenants towards those providing goods or services not easily delivered via the internet. This strategy shifts the mix of tenants away from department and mid-range clothing stores and towards retailers selling food, chemists, and services such as personal grooming. A dress, pair of jeans or a book can be bought easily on Amazon, but not a haircut or a back massage.
As Amazon enters its second year of operations in Australia, it is still too early to declare that shopping centres will definitively weather the storm of online retailing. However, 2019 is likely to provide investors with a better indication of the extent to which bricks-and-mortar retailing has a place in the retail landscape.
4. “Mining [or developing] on Wall Street”
The term “mining on Wall Street” refers to the concept that buying other mining companies can be a cheaper and lower-risk means for a mining company to build its assets than finding and developing those assets themselves.
Takeovers have been a feature of the LPT market for several years. We have seen Australian listed property trusts grow larger by taking over smaller listed trusts, and foreign buyers taking over trusts to gain an instant foothold into the Australian market.
Throughout 2018, we saw a spirited bidding war between Blackstone of the US and OMERS of Canada for Investa Office Trust, which resulted in the Canadians paying $3.3 billion for Australia’s second-largest listed office trust.
Given Australia’s high relative rental yields and solid domestic economy, coupled with global real estate funds that have a mandate to invest, we expect takeovers again to be a feature of the Australian listed property market in 2019. Activity is most likely in the office and industrial sectors.
At a more micro level, we expect that LPTs trading at a discount are likely to institute on-market share buybacks. Given the low level of gearing (debt relative to equity) across the listed property sector, more value can be delivered to a trust’s unitholders by buying back stock that is trading at a discount, compared to management going out and developing new assets.
Buying back stock on-market puts upward pressure on share prices and a trust’s net assets per unit, and also avoids the need for a property trust to pay development fees to local councils or commissions to real estate agents.
Summary
Looking ahead over 2019 we see the listed property market offering investors relatively stable returns, with some positive factors offsetting some of the negatives, to give minimal capital growth. In this environment, we see distributions as the primary source of the returns that investors can expect.
This article originally appeared in the ASX’s January 2019 Investor Magazine
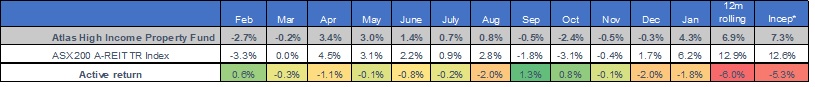
January Monthly Newsletter Atlas High Income Property Fund
- Markets were very strong globally in January, with the much anticipated “Santa Claus Rally” being pushed out to 2019 after a dismal December period. Listed Property was again one of the top performing sectors on the ASX up +6.2%.
- The Atlas High Income Property Fund gained +4.3% in January, lagging the exceptionally strong index. The key driver of property index performance was strong returns from the Trusts whose earnings contain a significant proportion of development profits. With trusts such as Goodman and Charter Hall now being valued at over twenty times forward earnings, the market is pricing these trusts as if we were in the early days of a property boom, rather than in one that is visibly unwinding.
- The Fund remains populated with trusts that offer investors recurring earnings streams from rental income rather than development profits. This should deliver a more stable stream of distributions throughout the property cycle.
Go to Monthly Newsletters for a more detailed discussion of the listed property market and the fund’s strategy going into 2019.