

Last week in part one of Atlas’ surprisingly popular series on financial statement trickery – Earnings Chicanery, we looked at the three financial statements and some measures a company can take to “dress up” their financial results. In part two we are going to build on this and take a look at some warning signs that there may be problems with a company’s financial statements.
 Red Flag 1: The statements don’t match
On results day most attention is focused upon a company’s profit and loss statement. In particular, analysts and commentators scrutinise whether the company has achieved the expected profit or earnings per share guidance, which was usually given at the last result. Whilst the profit and loss statement usually provides good guidance as to how the company has traded over the past six months, as discussed last week it is also the statement most open to manipulation and should be read in conjunction with the cash flow statement. It is a good idea to compare a company’s operating cash flow with its reported profits. If there is a big divergence, then the accounts should be examined carefully.
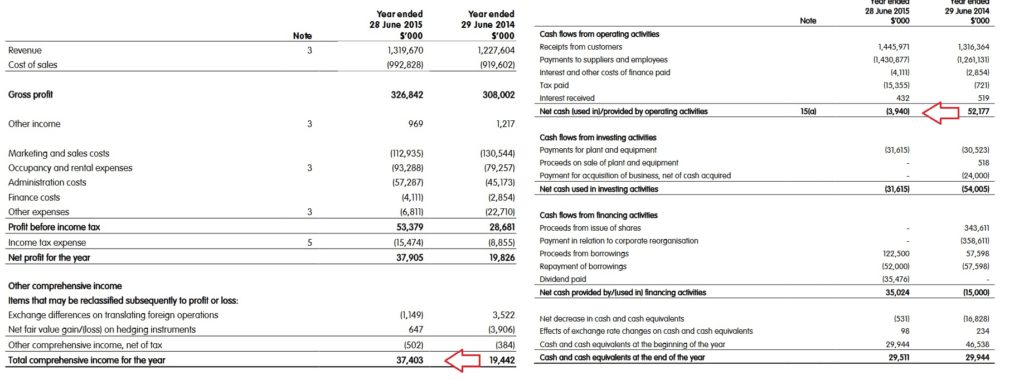
The red flag that we are looking for here is when a company’s cash flow statement and profit and loss statements are moving in different directions over an 18 month period, and where a company is showing growing profitability, but declining cash flows. In the below table from the 2015 accounts, Dick Smith Holdings reported income growing from $19 million to $38 million, yet operating cash flow fell from $52 million to -$4 million. This suggests that the sales generating profits reported on the profit and loss statement were actually pushing the company towards administration.
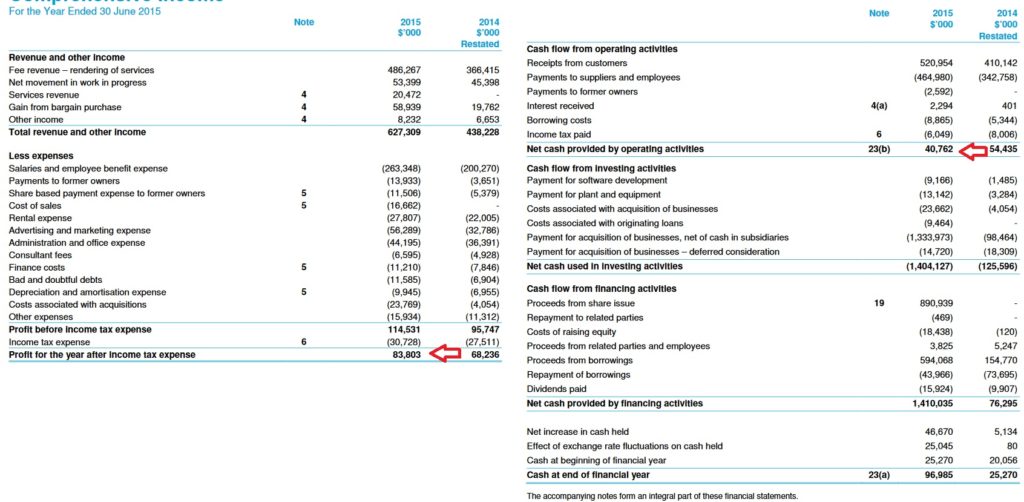
Another recent example of this can be seen in Slater+Gordon. In the below table from their 2015 accounts, the company reported that 2015 financial year profits were up +6% to $84 million, yet their operating cash flow had deteriorated by -25% to $41 million. Here it appears that the company was overstating its profits through the accounting of its “legal work in progress”, and was overly aggressive in anticipating the expected cash generated through won cases. Whilst the company was able to deliver the earnings growth the market was expecting, in reality the declining incoming cash flows showed signs that it was actually a business in trouble.
However there are exceptions to the rule
The earnings on the profit and loss statement for some businesses can diverge from the cash flow statement. For example, a construction company such as Cimic (nee Leightons) or Downer might not physically be paid until July in the next financial year for work done on a railway project. Here the profits at a point in time may be greater than the cashflows, though the lumpiness of the cash flows received from large individual contracts will even out over time.
Red Flag 2: A company has consistent extraordinary
Extraordinary items are gains or losses included on a company’s income statement from unusual or infrequent events. Importantly, they are excluded from a company’s operating earnings. These items are excluded from earnings to give investors a more “normalised” view of how the company has performed over the period. For example, if an industrial company such as Amcor books a $50 million gain from selling excess industrial land, including this profit would obscure information about how the company’s packaging businesses have performed over the past six months.
While reporting extraordinary items can be valid and useful, investors should be wary or make their own adjustments to company earnings where a company has frequent (and almost always negative) extraordinary items that they are seeking to exclude from their reported profits.
As a long-term observer of the Australian banks, almost every year they put through a write-off of software below the profit line. In my view, investing in banking software is a core part of their business model and it seems curious that the institution is willing to take the productivity benefits in their normalised earnings whilst ignoring a portion of the costs needed to achieve these gains.
Red Flag 3: Divergence from comparable companies
The warning sign we are looking for here is when a company consistently has higher average profitability, revenue growth or better working capital management than their industry peers. Invariably when management is asked they will give an answer that relates to management brilliance or superior controls, but realistically mature companies operating in the same industry tend to exhibit very similar characteristics. As such, their financial statements should to some extent correspond to the statements of companies operating in the same industry. For example, supermarkets such as Woolworths should have a similar cash conversion profile to Coles (operating cash flow divided by operating profits) and not dissimilar profit margins as they are selling identical products to largely the same set of customers.
Hollow Logs?
Occasionally management teams may be incentivised to under-report profits in any current period. This generally occurs when a company is under heightened union scrutiny due to wage negotiations with their employees, excessive government attention from perceived excessive profits, or expects a problem in the next year and wants to smooth their profits. For example, in the current environment of extremely low bad debts a bank could be incentivised to boost their bad debt provisions aggressively. This action would reduce current period profits, potentially a politically astute move when politicians are calling for a Royal Commission into Australia’s banking sector. These excess provisions, if not required, could then be written back at a later date to boost future profits.
Our Take
Earnings misrepresentation is difficult for investors to detect from the publicly available accounts, but when revealed can sometimes have extreme results for a company’s share prices. In my experience this is more an art than a science, as the investor gets a sense that something is not right with the accounts, rather than definitive proof of earnings manipulation. Normally actual manipulation generally only becomes obvious ex post facto, after management has been removed or a company goes into administration.