Monthly Newsletter December 2017

  • The Fund posted a gain of +0.6% over the last month of 2017, ahead of the underlying ASX 200 A-REIT index. December was dominated by the news of the potential takeover of Westfield by Unibail-Rodamco. Outside of Westfield, the overall performance of the index was weak.
  • The Fund remains positioned towards Trusts that offer recurring earnings streams from rental income rather than development profits, we see that this is likely to position us well going into 2018, as the property development market cools.
  • In December the Fund paid a distribution of $0.05; an increase of +2.9% over the September quarter distribution.


Go to  Monthly Newsletters for a more detailed discussion of the listed property market in December and the fund’s strategy going into 2018.

Monthly Newsletter November 2017

  • The Fund posted a gain of +3.6% over the month of November, which was ahead of our expectations in an exceptionally strong month for the Australian Listed Property sector. The derivatives overlay which we use to both enhance income and protect capital will naturally cause performance to lag in very strongly performing months.
  • The Fund remains positioned towards Trusts that offer recurring earnings streams from rental income,  rather than development profits. After the McGrath profit warning in November (attributed to slowing off the plan apartment sales), we remain convinced that this strategy will outperform as the market gives a higher value to recurring earnings as development profits being to wane.


Go to  Monthly Newsletters for a more detailed discussion of the listed property market in November and the fund’s strategy going into 2018.

Earnings Chicanery Part Two

Last week in part one of Atlas’ surprisingly popular series on financial statement trickery – Earnings Chicanery, we looked at the three financial statements and some measures a company can take to “dress up” their financial results. In part two we are going to build on this and take a look at some warning signs that there may be problems with a company’s financial statements.

Red Flag 1: The statements don’t match

On results day most attention is focused upon a company’s profit and loss statement. In particular, analysts and commentators scrutinise whether the company has achieved the expected profit or earnings per share guidance, which was usually given at the last result. Whilst the profit and loss statement usually provides good guidance as to how the company has traded over the past six months, as discussed last week it is also the statement most open to manipulation and should be read in conjunction with the cash flow statement. It is a good idea to compare a company’s operating cash flow with its reported profits. If there is a big divergence, then the accounts should be examined carefully.

The red flag that we are looking for here is when a company’s cash flow statement and profit and loss statements are moving in different directions over an 18 month period, and where a company is showing growing profitability, but declining cash flows. In the below table from the 2015 accounts, Dick Smith Holdings reported income growing from $19 million to $38 million, yet operating cash flow fell from $52 million to -$4 million.  This suggests that the sales generating profits reported on the profit and loss statement were actually pushing the company towards administration.

Another recent example of this can be seen in Slater+Gordon. In the below table from their 2015 accounts, the company reported that 2015 financial year profits were up +6% to $84 million, yet their operating cash flow had deteriorated by -25% to $41 million. Here it appears that the company was overstating its profits through the accounting of its “legal work in progress”, and was overly aggressive in anticipating the expected cash generated through won cases. Whilst the company was able to deliver the earnings growth the market was expecting, in reality the declining incoming cash flows showed signs that it was actually a business in trouble.

However there are exceptions to the rule
The earnings on the profit and loss statement for some businesses can diverge from the cash flow statement. For example, a construction company such as Cimic (nee Leightons) or Downer might not physically be paid until July in the next financial year for work done on a railway project. Here the profits at a point in time may be greater than the cashflows, though the lumpiness of the cash flows received from large individual contracts will even out over time.

Red Flag 2: A company has consistent extraordinary
Extraordinary items are gains or losses included on a company’s income statement from unusual or infrequent events. Importantly, they are excluded from a company’s operating earnings. These items are excluded from earnings to give investors a more “normalised” view of how the company has performed over the period. For example, if an industrial company such as Amcor books a $50 million gain from selling excess industrial land, including this profit would obscure information about how the company’s packaging businesses have performed over the past six months.

While reporting extraordinary items can be valid and useful, investors should be wary or make their own adjustments to company earnings where a company has frequent (and almost always negative) extraordinary items that they are seeking to exclude from their reported profits.

As a long-term observer of the Australian banks, almost every year they put through a write-off of software below the profit line. In my view, investing in banking software is a core part of their business model and it seems curious that the institution is willing to take the productivity benefits in their normalised earnings whilst ignoring a portion of the costs needed to achieve these gains.

Red Flag 3: Divergence from comparable companies
The warning sign we are looking for here is when a company consistently has higher average profitability, revenue growth or better working capital management than their industry peers. Invariably when management is asked they will give an answer that relates to management brilliance or superior controls, but realistically mature companies operating in the same industry tend to exhibit very similar characteristics. As such, their financial statements should to some extent correspond to the statements of companies operating in the same industry. For example, supermarkets such as Woolworths should have a similar cash conversion profile to Coles (operating cash flow divided by operating profits) and not dissimilar profit margins as they are selling identical products to largely the same set of customers.

Hollow Logs?
Occasionally management teams may be incentivised to under-report profits in any current period. This generally occurs when a company is under heightened union scrutiny due to wage negotiations with their employees, excessive government attention from perceived excessive profits, or expects a problem in the next year and wants to smooth their profits. For example, in the current environment of extremely low bad debts a bank could be incentivised to boost their bad debt provisions aggressively. This action would reduce current period profits, potentially a politically astute move when politicians are calling for a Royal Commission into Australia’s banking sector. These excess provisions, if not required, could then be written back at a later date to boost future profits.

Our Take

Earnings misrepresentation is difficult for investors to detect from the publicly available accounts, but when revealed can sometimes have extreme results for a company’s share prices. In my experience this is more an art than a science, as the investor gets a sense that something is not right with the accounts, rather than definitive proof of earnings manipulation. Normally actual manipulation generally only becomes obvious ex post facto, after management has been removed or a company goes into administration.

Banks Reporting Season Scorecard 2017

Over the last ten days the major Australian banks have reported their financial results for 2017, reporting collective annual profits of $31.5 billion. In comparison to the May reporting season (which saw the surprise introduction of a 0.06% levy on the liabilities and $50 billion being wiped off the bank’s collective market capitalisation), the results were mostly in line with expectations. A key feature that we noticed was how efficiently the financial impact of this “game changing” levy or tax was passed onto borrowers, something that we expected when we looked at the bank results earlier this year in the May Reporting Season Score Card.

In this piece, we are going to look at the common themes emerging from the November reporting season, differentiate between the different banks and hand out our reporting season awards to the financial intermediaries that grease the wheels of Australian capitalism.

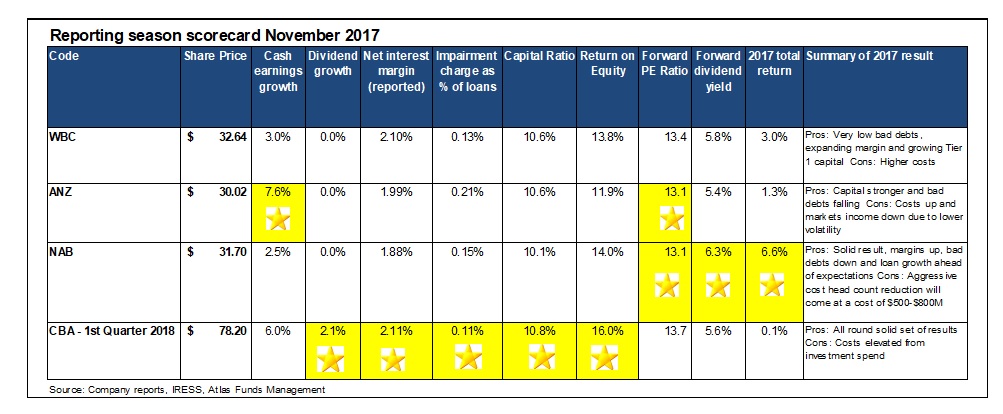
Across the sector profit growth was generally in-line with the credit growth in the overall Australian economy. ANZ reported headline profit growth of 7.6% when backing out the impact of the sale of the bank’s Asian retail businesses, Esanda and property gains from 2016. The solid profit growth displayed across the sector was achieved by improving economic conditions and lower bad debts. All of the banks reported lower trading income due to decreased volatility over the year.  During periods of higher market volatility, the banks can boost their income by both selling more foreign exchange and interest rate derivative contracts to their clients. However, they can also generate trading income by using their large balance sheet reserves to trade securities on the global markets.

Gold Star

Angry on costs: Reducing costs featured prominently in the plans of bank CEOs for the upcoming year, with much discussion about branch closures and headcount reductions. The removal of ATM bank charges and the migration of transactional banking from the physical bank branch to the internet is likely to deliver an efficiency dividend to the banks. NAB took the most aggressive stance, announcing that the bank will reduce its workforce by 6,000 employees due to business simplification and increasing automation. However, this will come at a cost with NAB expecting to book a restructuring charge of between $500-$800 million in 2018 and increases in investment spend by $1.5 billion.

Gold Star 

Bad debt charges still very low: One of the key themes across the four major banks and indeed the biggest driver of earnings growth over the last few years has been the ongoing decline in bad debts. Falling bad debts boost bank profitability, as loans are priced assuming that a certain percentage of borrowers will be unable to repay and that the outstanding loan amount is greater than the collateral eventually recovered. Bad debts fell further in 2017, as some previously stressed or non-performing loans were paid off or returned to making interest payments, primarily due to a buoyant East Coast property market and higher commodity prices. CBA gets the gold star with a very small impairment charge in 1st quarter 2018 courtesy of their higher weight to housing loans in their loan book. Historically home loans attract the lowest level of defaults.

Gold Star  

Dividend growth stalled but may return: Across the sector dividend growth has essentially stopped, with CBA providing the only increase of 9 cents over 2016. With relatively benign profit growth a bank can either increase dividends to shareholders or retain profits to build capital (thereby protecting banks against financial shocks); but not both. In the recent set of results the banks have held dividends steady to boost their Tier 1 capital ratios. Additionally, dividend growth has been limited as the banks have had to absorb the impact of the additional shares issued in late 2015 to boost capital.

Looking ahead, there may be some capacity to increase dividends (especially from ANZ and CBA after asset sales), as the rebuild of bank capital to APRA’s standards is largely complete. The major Australian banks in aggregate are currently sitting on a grossed-up yield (including franking credits) of 8.2%.

Gold Star

Net interest margins in aggregate increased in 2017, despite the imposition of the major bank levy. This was attributed to lower funding costs and repricing of existing loans to higher rates. In response to regulator concerns about an over-heated residential property market and in particular the growth in interest-only loans to property investors; in 2017 the banks have repriced these loans higher than those repaying both principal and interest. For example, Westpac’s currently charges 6.3% on an interest only loan to an investor, which contrasts to the 4.4% being charged to owner occupiers paying both principal and interest. This has had the impact of boosting bank net interest margins.

One of the key things we looked at closely during this results season was signs of expanding net interest margin (Interest Received – Interest Paid) divided by Average Invested Assets), and this was apparent even after allowing for May’s Major Bank Levy

Gold Star Australian banking oligopoly

Total Returns: In 2017 only NAB has been the top performing bank, benefiting  from delivering cleaner results, after it jettisoned its UK issues with spin-off of the Clydesdale Bank and Yorkshire Bank. CBA has been the worst performing bank as it faces both the imminent retirement of its CEO and the uncertainty around possible fines from foreign regulators for not complying with anti-money laundering laws. This has resulted in CBA losing the market premium rating that it has enjoyed for a number of years over the other banks.

Gold Star

Our Take

What to do with the Australian banks is one of the major questions facing both institutional and retail investors alike. The Australian banks have been very successful over the past few years in generating record profits, benefiting from lower competition from non-bank lenders and record low bad debts.  Looking ahead it is not easy to see how the banks can deliver earnings growth above the low single digits in an environment of low credit growth, increased regulatory scrutiny and the sale of some of their insurance and wealth management divisions.

Competition amongst the big four banks is likely to increase, as for the first time since 1987 (NAB’s purchase of Clydesdale Bank) we have no Australian banks distracted by foreign adventures, with all four focused on the Australian market.  However, looking around the Australian market the banks look relatively cheap, are well capitalized and unlike other income stocks such as Telstra should have little difficulty in maintaining their high fully franked dividends.

Monthly Newsletter October 2017

  • The Fund posted a small gain of +0.8% over the month of October, trailing the S&P/ASX 200 A-REIT Accumulation index that was dragged upwards by the strong performance of the trusts with property development earnings. Following the McGrath profit warning in the first week of November (attributed to slowing off the plan apartment sales), we are happy with the Fund’s focus on rent collectors rather than property developers.
  • In the first week of October the Fund paid out a distribution to investors of 4.85 cents per unit.
  • In October the Fund bought put protection out till March 2018 that will offset some of the impact of a significant fall over the next five months. In our opinion the market appears to be mispricing downside risk and we will look at add to this protection.

Go to  Monthly Newsletters for a more detailed discussion of the listed property market in October and the fund’s strategy