Why Institutional Investors avoid Residential Property

One of the misconceptions investors have is that the $123 billion dollar listed property index is primarily exposed to residential real estate. In fact, residential property comprises a small part of the index, with only 4% of the value of the index coming from trusts exposed to residential property. Further, this exposure primarily comes from developers selling finished apartments or home and land packages, not from actually owning housing real estate that is rented out.


Last month Mirvac announced they will be bringing Australia’s first major build-to-rent apartment development to market in a move that could potentially address housing affordability issues. In this week’s piece, we will look at why institutional investors have shied away from investing in residential developments, unlike in the US and the UK where this sector is a growing part of the Listed Property indices.

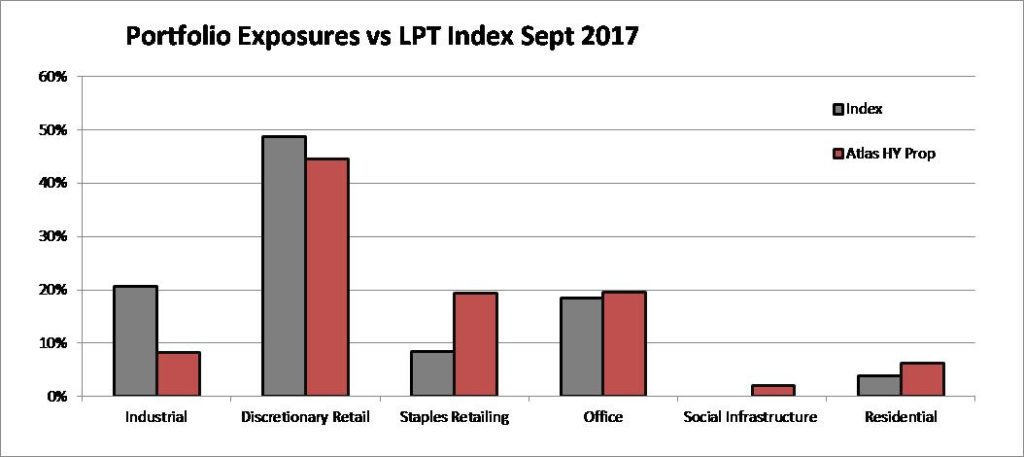
Residential property has attracted little interest from institutional investors as it is an area where retail investors have an investment edge. In the below chart, the grey bars show that exposure to residential real estate comprised 4% of the S&P/ASX 200 A-REIT index in September 2017, or $4.7 billion. This is dwarfed by the value of the discretionary retail ($59 billion), industrial ($25 billion), and office ($22 billion) real estate assets listed on the ASX. In comparison in the US, the residential sector accounts for around 25% of the $US2 trillion in institutional property investment, placing the sector just behind office.


Whilst the smaller transaction size of buying a two-bedroom apartment is attractive to retail investors (compared to an industrial warehouse or an office tower which may be valued in the tens to hundreds of millions), there are three structural reasons why retail investors dominate residential property investment.

Capital gains tax “crowds out” corporate investors

Although the domestic rental sector exists  in LPTs in the US and Europe, in Australia the tax-free status of capital gains for owner-occupiers selling their primary dwelling has had the effect of bidding up the purchase prices of residential real estate. For example, when a company generates a $500,000 capital gain from selling an apartment, they would approximately be liable to pay approximately $108,000 in capital gains tax, whereas the owner-occupier pays no tax on the capital gains made on a similar investment. This discrepancy in the tax treatment allows the owner-occupier to pay more for the same real estate assets, and thus has contributed to the low yields mentioned below.

Negative gearing

Similarly, individual retail investors benefit from the generous tax treatment in Australia that allows them to negatively gear properties. There are three types of gearing depending on the income earned from an investment property: positive, neutral and negative. A property is negatively geared when the rental return is less than the interest repayments and outgoings, placing the investor in a position of losing income on an annual basis. However, under Australian tax law, investors can offset the cost of owning the property (including the interest paid on a loan) against other assessable income. This incentivises individual high-taxpaying investors to buy a property at a price where it is cash flow negative in order to maximise their near-term tax returns and bet on capital gains. Whilst companies and property trusts can also access taxation benefits from borrowing to buy real estate assets, a rich doctor on a top marginal tax rate of 47% has a stronger incentive to raise their paddle at an auction.

Yields on residential property too low

At current prices, the yield that residential property offers are not very attractive for listed vehicles. At the moment, the ASX 200 A-REIT index offers an average yield of 5%. This compares very favourably with the yields from investing in residential property. SQM Research reported recently that the implied gross rental yield for a 3-bedroom house in Sydney of 3% with a 2-bedroom apartment yielding  4% in July 2017. After borrowing costs, council rates, insurance, and maintenance capex, the net yield is estimated to average around 1%. With listed property investors focused on yield receiving on average ~ 5% from property trusts investing in office towers and shopping centres, such a low yield would only be accepted if it was offset by high and certain capital gains.
Mirvac’s new “build to rent” fund

In August Mirvac announced their intention to develop a build to rent fund with assets based initially in Sydney. This fund is likely to be targeted at institutional investor, rather than retail investors, who generally already have a significant exposure to residential real estate. This looks to be an opportunity for Mirvac to access both development profit (profit margin +25% in FY17) and also an ongoing funds management fee on the completed assets. However, we would be surprised to see much of Mirvac’s own capital invested in the fund. In 2017 Mirvac generated a 18% return on the $1.8 billion of capital invested in its residential development business (ROIC). Mathematically it is hard to see how investing in their own finished product will generate returns higher than the trust’s average cost of capital.

Our take

Whilst the residential sector is a large part of the overall stock of Australian real estate assets, without significant taxation concessions it is hard to see this sector garnering much interest from institutional investors, especially for income-focused investors such as Atlas Funds Management. The Atlas High Income Property Fund’s strategy of populating the portfolio with higher quality domestic rent collectors combined with a derivative overlay strategy to enhance income should continue outperform in a property market that is trading sideways. We see that the majority of returns over the next 12 months will come from distributions and income from writing call options over existing holdings, rather than spectacular capital gains.


Give me my money back!

Two weeks ago, shopping centre owner Vicinity announced it would buy back up to 5% of its stock on market after it delivered its full-year results on August 15. This delivered investors an immediate 5% bounce in the trust’s share price, as the market anticipated over $500 million of Vicinity’s stock being repurchased over the next 12 months.

In this week’s piece, we are going to look at share buy-backs and why they generally have a positive influence on a company’s share price. However, buy-backs are not always positive. Next week in the second part of our deeper dive into buy-backs, we will analyse the bad buy-backs and the cheapest ones of all to execute: the fake buy-backs that create the illusion of share price support.

Buy-backs are almost universally popular with investors as they not only reduce the number of shares outstanding by which to divide a company’s profit, but they return certain capital to investors today, rather than waiting for an uncertain return tomorrow. This is important, in light of the numerous occasions where company management teams have frittered away excess cash on questionable acquisitions or hastily conceived expansion plans designed to buy growth or move into new markets.

Types of buy-backs

There are essentially two ways that a company can repurchase or buy-back its shares. They can do it on-market using a stock broker, or off-market by inviting shareholders to tender their shares for repurchase. Off-market buy backs are generally done by companies such as BHP that have large balances of franking credits, as the buy-back can be structured in a tax-effective manner for domestic investors by returning a combination of cash and tax credits. Companies such as CSL that earn the bulk of their profits offshore are more likely to buy back their shares directly from investors on the ASX as they don’t have excess franking credits.
Occasionally companies will limit the buy-back to a particular investor, though this is usually very poorly received by the wider investor base. The last company that tried to do this was Woodside in 2014 when it offered the equivalent of $48 per share to buy back$2.7 billion in shares from Shell. This failed to get shareholder approval and with the share price currently around $29, it was clearly the right move for shareholders to block this move. Currently Rio Tinto is conducting an on-market buy-back that is limited to the company’s London listed shares. This selective buy-back is being done to close the price discount at which Rio’s shares trade on the London exchange compared with the price in Australia.

Why investors like buy-backs
Signal that future prospects are good

Buy-backs signal to the markets that a company’s management has strong confidence in the future financial prospects of the company, as the company is returning what it sees as excess capital to shareholders. A weak company in a weak financial position, with nervous lenders raising concerns about the repayment of debts due is extremely unlikely to be returning capital to shareholders. As raising new capital is both time consuming and expensive (fees going to investment bankers in sharp suits), if a management team has some concerns about the outlook, they will retain excess capital on their balance sheet.

Change in capital structure

By returning cash to shareholders, the buy-back alters the capital structure of a company, by increasing the proportion of debt on its balance sheet used to fund its activities. Similarly, it increases the financial leverage or net gearing by reducing the cash component in the denominator of the below calculation.
Net Gearing = (Total Debt – Cash) / Book Value of Equity
If the company is “under-geared”, repurchasing of shares increases leverage. In the case of shopping centre owner Vicinity, due to the $1.5 billion in asset sales sold over the past 18 months, the trust’s gearing decreased to 24.7%. Buying back stock below net tangible assets (NTA) is not only earnings accretive, but it organically increases financial leverage and thus the equity owner’s share of rising profits.

Reduces the chance of poor acquisitions

A buy-back also provides investors with comfort that excess cash is not just being retained for empire building, possibly to be squandered on bad investments which tend to be made by companies in cyclical industries at their peak. A great example of this was Rio Tinto’s purchase of Canada’s Alcan in 2007, which not only drained the company of the excess capital built up by the mining boom, but resulted in an ignominious and highly dilutive rights issue in 2009.

Scares off short sellers

Buy-backs tend to cause share prices to trade upwards, as the companies’ buying puts upwards pressure on shares. When buying back shares, companies are required to file a new notice after each day when they buy shares. This notice is posted on the ASX for investors to see and details the number of shares bought and the price paid.

This may cause short sellers to close their short positions in a company conducting a buy-back (also causing upward price pressure), as they know that there will be a new buyer consistently purchasing shares in a company in which they have a short interest. Further, a company is likely to step up that program and increase buying on any share price weakness.

When I was working at a US investment bank writing research on building materials company James Hardie, I was able to observe the wave of buying from short sellers of James Hardie on the morning that the company announced a share buy-back. This pushed the share price higher than the announcement actually warranted.

Our Take

Returning excess capital to investors as distributions rather than retaining it reduces the capacity for management teams (acting as investors’ agents) to expend capital in ways that might not be in the best interests of investors. Where excess capital is returned to investors in the form of distributions and buy-backs, this excess capital sits in investors’ bank accounts rather than the company’s. If management want additional equity for an acquisition they are then required to make an investment case to their investors. We are expecting the announcements of a few buy-backs over the next few weeks, especially in the Listed Property space from trusts that are able to buy back their own shares that are trading below net tangible assets per share.

Monthly Performance May 2017

  • May 2017 marked the launch of the Atlas High Income Property Fund into the turbulent Australian equity market.
  • The Australian Listed Property index fell -1.3% over the month, which was ahead of the wider Australian equity market that declined -2.8%.
  • The Fund’s unit price was essentially unchanged as we are maintaining a cautious approach in constructing the portfolio. Losses were balanced off against gains from call options sold.

Go to  Monthly Newsletters for a more detailed discussion of the listed property market in May and the fund’s strategy

Faded Blue Chips – solid stocks with feet of clay

Blue Chip stocks are the large well-established household names, in the top 50 companies listed on the ASX with a market value in the tens of billions. Stockbrokers recommend these companies to their clients based on the perception that they are safe and stable and following the axiom “Nobody ever got fired for choosing IBM“. They are viewed safe for advisors to recommend even if they fall in value. However, like Ozymandias in the poem by Shelley, strong and financially sound companies are not always permanent and can become buried in the Egyptian desert like the statue of the pharaoh.

“I met a traveller from an antique land, who said— “Two vast and trunkless legs of stone

Stand in the desert.  Near them, on the sand, Half sunk a shattered visage lies, whose frown,

And wrinkled lip, and sneer of cold command, tell that its sculptor well those passions read

Which yet survive, stamped on these lifeless things, the hand that mocked them, and the heart that fed;

And on the pedestal, these words appear: My name is Ozymandias, King of Kings; Look on my Works, ye Mighty, and despair! Nothing beside remains. Round the decay of that colossal Wreck, boundless and bare, the lone and level sands stretch far away.”

Shelley’s Ozymandias 1818

In this week’s piece, we are going to look at blue chips on the ASX over the last quarter century, the factors that caused them to decline and some thoughts on the current crop of “blue chip” companies on the ASX and their permanence.

What is a blue-chip stock?

The term “Blue Chip Stock” was first used by Oliver Gingold of Dow Jones in 1923 and referred to high priced stocks. “Blue” was a poker reference, as in poker sets the highest value chip is traditionally the blue one. Since then the term has come to denote high quality stocks, with consistent revenue growth and dominant market positions in their industry. They typically have a stable debt to equity/interest coverage ratios and generate superior return on equity (ROE).  Over time this translates into a high market capitalisation that places a company in the Top 50 companies listed on the ASX. Currently the smallest stock (BlueScope Steel) in the ASX Top 50 has a market value of almost A$7 billion.

The below table looks at the Top 50 stocks on the ASX by market valuation in four points in time over the last 26 years. There are many familiar names such as BHP and Westpac that were considered blue chips in 1991 and retain that status today, but there are also many that would be unfamiliar to many investors today. Whilst most of these (Cadbury Schweppes, North Broken Hill, PNO, Dairy Farm Holdings) have disappeared from the share market due to being taken over by other companies, in each period there are a number of supposed blue chips that ultimately went into administration or faded away to a small fraction of their previous size. The faded blue chips in the table are coloured in red. We will now examine the factors that contributed to their declines.

Too much debt

In early 2007 shopping centre trust Centro Properties was riding high after making a string of acquisitions in Australia and the USA. It was viewed as highly innovative, dubbed the Macquarie Bank of Property Trusts due to its use of debt to create a global property empire. After acquiring a portfolio of 469 small shopping centres across 38 US states for A$3.9 billion, the trust was managing A$26 billion of property. As a result of the acquisition, Centro Properties upgraded its forecast 2008 financial year distribution growth to 19%. However instead of rising distributions, in December 2007 Centro Properties faced significant problems in refinancing US$5.5 billion of debt that was due in a very challenging market. Additionally, the shopping centre owner faced questions about the accuracy of their financial accounts after billions of dollars in short-term bridging debt was classified as long-term debt. As a result of asset write offs, Centro Properties in June 2009 reported a negative net tangible assets (NTA) of -$2.23 per share (it was trading at $0.16 per share at the time). Ultimately equity holders were essentially wiped out as the mountainous debt burden was converted into equity.

Financial Engineering

In 1998 zinc miner Pasminco was one of the premier global zinc miners after buying the Century project from Rio Tinto. The company developed an audacious hedging strategy to lower debt costs by borrowing in USD and hedged the currency based on the expectation that the AUD would remain between US68c and US65c. Unfortunately, the AUD/USD fell to below 51c in 2001 at the same time that the zinc price crashed. This left the company with limited cash flow and losses on the hedge book that blew out to $850 million when the company went into administration in late 2001.

The combination of too much debt and financial engineering

No discussion of faded blue chips would be complete without looking at investment bank Babcock & Brown. At its peak in June 2007, the investment bank was lauded as a creative user of financial structuring and a fee-generating machine that propelled the company’s share price to $34.63, with a market capitalisation above $9 billion. From meetings that I had with Babcock & Brown management prior to the GFC, they also made no secret of the fact that only a small amount of their earnings could be characterised as “recurring” and that most of the profit (used to pay dividends) was generated by revaluing assets cannily acquired by the company.

Similarly, to Centro, Babcock & Brown both entered the GFC with too much debt and – more importantly – too much short-term debt that needed to be refinanced in a challenging market. In June 2007, the Babcock & Brown group had amassed $80 billion in assets, supported by $77 billion in debt, much of this held off balance sheet or characterised as “non-recourse” and held by satellite funds.  The company collapsed in 2009 after a falling share price triggered debt covenants and the company was unable to refinance the debt due. Ultimately, in very complex liquidation proceedings the noteholders ended up receiving 2c in dollar for bonds held, with equity holders receiving nothing.

Technology that did not work as expected

The orbital engine was invented by Ralph Sarich in 1972and at one time was expected to revolutionise combustion engines, with fewer moving parts and greater efficiency.  In 1991, the future for Orbital – a company that owned the technology for orbital engines – looked bright and BHP took a 25% stake in the company. Despite this promise, a range of technical problems with cooling and lubricating the engine proved unsolvable and both the founder and BHP ran for the exits. Orbital still exists selling fuel injection technology and propulsion systems for drones, but with a share price of $0.59 which is a long way from its peak at $24.

ERG’s future looked bright 17 years ago and was a glamour tech stock listed on the ASX offering smartcards for mass transit systems from Moscow to Manila. Whilst the technology itself was sound the company was effectively sunk, not by the offshore moves but by difficulties in implementing the ERG’s T-Card in Sydney and issues with the NSW State Government which led to the project being scrapped.  Ultimately this resulted in lawsuits and the company was delisted in 2009.

The above table shows the ASX Top 50 as of April 2017 ranked by market capitalisation.  Whilst it is usually hard to identify at the time which strong companies will falter in the future, history strongly suggests that amongst this list there are one or two companies, currently considered blue chips that will either go into administration or slide back into insignificance. Below we identify some considerations that might influence the future fates of current blue chips.

High Debt

In 2013 Fortescue looked like a candidate for a blue chip that might blow up, with 70% gearing resulting from $10.5 billion in net debt. However, a period of sustained high iron ore prices has allowed the company to pay off $6.5 billion in debt and reduce gearing to a more manageable 30%.

Amongst the blue-chip stocks in the table above, the companies with the highest debt burden as measured by gearing (net debt divided by total equity) are Sydney Airport (770%), APA Group (242%), Transurban (225%) and Ramsay Healthcare (135%). The key characteristic of these heavily geared companies is the view that the stable returns from airports, pipelines, toll roads and hospital procedures affords the ability to service high levels of debt.

Whilst these companies own wonderful assets and point to both the spread of debt maturities and their interest rate hedges (which lock in a portion of the company’s debt at a fixed rate), these hedges will expire and debt currently attracting low rates will almost certainly have to be refinanced at higher rates. For example, in the five-year period 2020 to 2024, Sydney Airport will have to refinance on average $806 million in debt per year.

Technology does not work as expected

Whilst we do not consider this likely and believe that the company has instituted many safeguards, blood therapy company CSL does face the risk of product recalls through contamination. In 2008, CSL’s rival Baxter faced a product recall after 81 deaths were linked to tainted blood thinning drugs produced under contract in China, but sold in the US under Baxter’s name.

 Left Field

Political factors could potentially derail BHP spin-off S32, which has climbed into the ASX Top 50 courtesy of higher coal and manganese prices. In February S32 reported that 35% of their profits were earned from the company’s coal and manganese mines and aluminium smelters in South Africa and Mozambique. Significant political unrest, power disruption from Eskom or amendments to South Africa’s 2002 mining charter requiring higher percentages of black ownership could result in significant falls in S32’s share price.

Our Take

We see that investors spend far too much time trying to pick the next Apple or CSL and not enough time thinking about whether there is a Pasminco lurking in their portfolio. Rather than chasing high return and higher risk investments, Atlas observes that superior performance and lower volatility of returns are best delivered by concentrating on avoiding mistakes or “performance torpedoes”.  Looking at the current list of blue chip stocks, we consider that the most probable candidate to become a fallen angel is likely to come from the list of highly geared utilities.