Over the past twelve months, small companies (as measured by the ASX’s Small Ordinaries) have returned 22%, outperforming large caps (ASX Top 100) by almost 10%. This has led to numerous articles in the financial press claiming that small is beautiful and that investors should look beyond large Australian companies to add growth and excitement to their portfolios.
In this week’s piece, we are going to look at the reasons behind this performance discrepancy on the ASX, and why investors tend to get compensated for investing in small capitalisation companies.

Large capitalisation companies are defined as those in the Top 100 companies listed on the ASX. They tend to be large household names such as NAB, Woolworths or Harvey Norman. Currently the smallest large-cap company – measured by market capitalisation (shares outstanding multiplied by price) – is CSR with a market capitalisation of $2.1 billion which has been listed on the ASX since 1962. Conversely, companies classified as small caps are generally newer companies seeking to grow earnings by developing a new mine, product or technology. An example is Afterpay Touch that was first listed last June. Often small companies grow at such a rate that they become classified as large companies like A2M Milk. However, this also works in the other direction in the case of declining companies like Myer.
Life is harder for smaller companies
At first glance, one would think that smaller companies on average should underperform large companies, as company size confers stability and a range of advantages. In other words, small companies have limited financial resources and fewer avenues to access the capital markets. These characteristics entail commercial disadvantages, for example, Westpac can easily raise capital from a number of sources quickly, whereas a small company may only be able to tap existing shareholders. Additionally, small companies generally face a higher cost of debt with a shorter tenor, as only large companies are able to sell 10-year bonds to the US Private Placement market. Larger companies can therefore negotiate more forcefully over interest rates with the domestic banks.
Additionally, smaller companies often have weaker competitive advantages than many large Australian companies that operate in cosy domestic oligopolies, where the incentive is mainly to maximise profits by managing the political environment to maintain the status quo. Arguably however the competitive advantages conferred by operating in domestic oligopolies can lead to destructive offshore acquisitions designed to deliver growth that may be elusive domestically, where the company is constrained by regulation or the actions of competitors protecting their market share. A recent example of this can be seen in Wesfarmers’ hardware acquisition in the UK and BHP’s foray into US shale gas.
Small companies outperform
Despite these challenges, since the 1980s a number of studies have shown that small-cap equities have historically outperformed large-cap equities on a risk-adjusted basis over the longer term. The most famous study of this phenomenon was done by Nobel laureates Fama and French[1] who looked at monthly returns between July 1926 and February 2012 in the US stock market. They found that during that time, small-cap stocks also delivered a cumulative excess return of 253% relative to large-company stocks. In their view, the outperformance of small caps over large caps was due to an element of risk unique to small companies; that is, investors are compensated for undertaking additional risk inherent to investing in companies with higher risk
As a former small-cap fund manager, my observation is that some of this outperformance can also be attributed to market inefficiency and not just compensation for additional risk. Inevitably smaller companies are less well understood by the overall market. They will be less subject to analyst coverage from the investment banks, which could increase the risk of mispricing. For example, there are 16 analysts working at large investment banks publishing research on BHP, all seeking to uncover new information or angles on this company currently worth $112 billion. Conversely, most small companies struggle to receive minimal – if any – coverage from stockbrokers.
The last twelve months in Australia
Over the last twelve months, small capitalisation companies listed on the ASX have outperformed their larger cousins by close to 10% on average, a significant gap. The largest 100 companies on the ASX have returned 13% including dividends, a pretty good return by historical standards. However, amongst these companies there is a significant variance in returns.
Amongst the large caps the top performing companies were CSL (56%), Santos (+88%), ResMed (+59%), and Macquarie (+48%), ably assisted by mining heavyweights BHP (+39%) and Rio (+25%). Whilst these are all great returns for investors the average return has been dragged down by Telstra (-26%), AMP (-29%), and Fortescue (-19%) as well as fallen angels Ramsay (-18%) and Harvey Norman (-15%). However, the real story behind the underperformance of large capitalisation stocks is the banking sector that has essentially done nothing over the past year: Westpac (-2%), NAB (0%), ANZ (+3%) and CBA (-7%). These four stocks represent close to a quarter of the ASX – though if we measured this four weeks ago the results would have been worse!
Whilst the returns over the last year from large companies such as CSL and Santos were impressive, they look quite pedestrian when compared with the star small-cap companies such as Afterpay Touch (+361%), Beach Energy (+186%), Appen (+161%), WiseTech Global (+113%), and A2M milk (+130%). The common theme amongst these is investors paying for early-stage IT or growth companies that benefit from leveraging exciting technologies or are M&A candidates for bigger companies.
The small cap index also has a large weighting to mining services and small mining companies that were on their knees in early 2016 but given their operating leverage have benefited from rising commodity prices in 2017 and 2018 courtesy of a Chinese stimulus plan. Still, investing in small companies is not without risks, as when things go wrong for a smaller company often the consequences are more extreme than for a larger more established company. Over the past year Retail Food Group (-89%), BlueSky (-74%), Isentia (-55%) and Myer (-32%) have caused a degree of pain for small cap investors, as well as former market darlings Ainsworth Game Tech (-53%), Vocus (-29%), Class Super (-26%) and Amaysim (-41%).
The last ten years
Over the past 10 years the large caps have actually outperformed the small caps by 30%, however we recognise that a big factor in this performance is related to the time frame used. As you can see from the below chart, the market crash during the GFC hit the smaller companies much harder than their larger cousins, with the small companies falling on average -48% in 2008 compared with the still very painful -29% fall for the Top 100 companies. When the economy falters, smaller companies have a greater risk of going into administration. Given the number of small companies listed on the ASX exposed to mining or mining services, share price falls are magnified when the downturn in the economy is accompanied by a fall in commodity prices as it was in 2008.
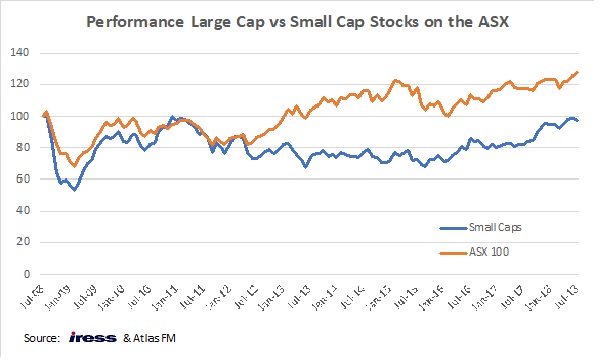 Additionally, after a recovery in 2009, the above chart shows that the small capitalisation index was unchanged until early 2017. Over this same period the large caps did well, particularly in the period 2012 -2015. This occurred as the large cap financials benefited from the removal of competition and falling rates globally, whilst the mining stocks bounced back courtesy of higher commodity prices from a range of Chinese stimulus plans.
[1] Fama, Eugene F & French, Kenneth R, 1992. ” The Cross-Section of Expected Stock Returns,” Journal of Finance, American Finance Association, vol. 47(2), pages 427-465, June.
Our Take
Since March 2009, the ASX has risen close to 60% and in our opinion, there is a range of companies on the ASX that are priced on the assumption that benign conditions will continue indefinitely. Towards the latter stages of any sustained bull market in equities, it is prudent for investors to have a close look at what they have in their portfolio. We would be disinclined to own small cap companies that rely on benign debt and equity markets to finance their growth or are “concept stocks” still proving up their business model. Whilst many of the larger companies might not have the “blue sky” growth prospects of some of the stellar small caps of the past year mentioned above, they do however have business models that have been tested during trying market conditions. With the ASX small companies index trading on 21x forward earnings one could think that you are paying quite a lot for this growth with a minimal margin of safety.
 Hugh Dive, founder and chief investment officer of Atlas Funds Management, said he “wouldn’t be surprised” to see CFS Group spin off the financial planning and mortgage broking units before the demerger.