Sticky fingers in many pies

The business of wealth management has been put under the microscope over the past month with the Royal Commission into the financial services industry. In March, the Commission focused on misdeeds in consumer lending and for the next two weeks in April it will be concerned with transgressions around financial advice.

The Royal Commission has highlighted the extent to which the major financials are involved in the business of managing Australia’s investments. Consequently, this week we are going to have a closer look at the funds management landscape in Australia. In particular we will examine the degree of vertical integration by the largest players of this industry that looks after A$3.4 trillion of investments for Australians.

Influence of the Major Institutions

The wealth management businesses of Australia’s major financial institutions (Commonwealth Bank, NAB, ANZ Bank, Westpac, Macquarie Bank and AMP) include funds management, life insurance and general insurance, investment administration platforms, and financial advice. The wealth management business is attractive for the banks, not only due to the government mandated growth that comes from rising compulsory superannuation contributions, but also because wealth management earnings carry a low capital charge. This appeal only increased with the $19 billion of capital raised in 2015 to meet Australian Prudential Regulation Authority’s (APRA) tougher stance on bank capital adequacy.

Whilst this might not be the most exciting of topics, changes to capital requirements have two important effects: they make funds management earnings more attractive to the banks, and also increase the cost of lending to business and home buyers. When a bank makes a standard home loan with a ~70% loan to value ratio (LVR), the Australian Prudential Regulation Authority (APRA) requires that the bank hold approximately $2 in capital for every $100 lent. This rises to $5 for every $100 in the case of a loan to a business that incurs a higher risk weighting. Mathematically, when a bank is required to quarantine more capital to conduct activities, their return on equity (ROE) declines. This decline may not seem very significant, but in an environment in which the Australian banks are facing higher capital requirements from regulators globally, earnings from wealth management are very attractive as they can boost the bank’s return on equity. Additionally, participating in the government mandated growing superannuation pool is seen as attractive to the major banks, since growing superannuation balances are expected to have a limited correlation with the credit cycle and demand for loans.

Vertical Integration: Clipping the Ticket at every stage

Over the last twenty years the major financial institutions either bought, or have organically created at great expense, a financial supermarket. This was based on the Allfinanz or bancassurance model, that assumed the banks could efficiently deliver banking, insurance and funds management through their existing networks, with employed tellers and financial advisors cross-selling “home brand” financial products. Aspirations to this model enticed the Commonwealth Bank to acquire Colonial in 2000, National Australia Bank to buy MLC, and Westpac to purchase BT and Rothschild Wealth Management. Additionally, by buying downstream financial advice groups, the major financial institutions acquired a distribution network for the financial products they manufacture such as managed funds, loans and life insurance.

In essence, the wealth management industry comprises a value chain of advice (financial advisers), portfolio administration (platforms) and manufacturing (funds management). The major financial institutions have captured a dominant market share in all three links in the wealth management chain via acquisitions and IT expenditure. As shown in the below chart on the right, the four major banks plus AMP and IOOF have financial relationships with just under 50% of the financial planners in Australia. Their market share had been increasing with acquisitions (such as Count, acquired by CBA in 2011 for example) and heightened compliance requirements that tend to favour the large institutions over smaller practices. However, over the past two years we have seen a swing away from this trend with the number of independent financial advisers growing. One of the potential outcomes from the current Royal Commission is that investors will become increasingly aware of the conflicts of interest inherent in the vertical integration of wealth management, and management and will shift towards using independent financial advisers.

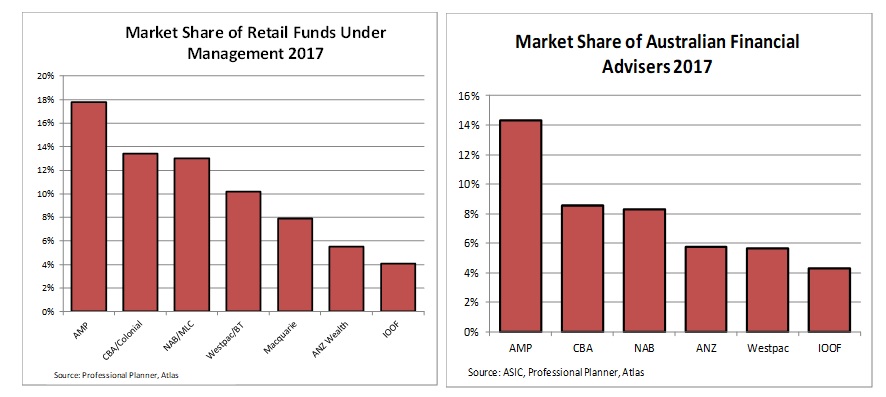
The major financial institutions have also been very successful in capturing a large share in the business of actually managing the money. The above chart on the left demonstrates the dominance that the large institutions enjoy in “manufacturing” the investment products, or funds for sale to retail investors. Currently the major banks plus AMP manage almost 80% of the retail funds under management, though this may change shortly with CBA looking at listing its funds management arm Colonial First State via an IPO. Westpac’s share of funds management is declining as the bank continues to reduce its ownership position in BT Investment Management.
Finally, investment platforms are the “middle man” in the process, connecting the fund manager to the adviser by providing administration services and tax reporting for a client’s portfolio of managed funds, shares and cash. Platforms generally charge around 0.3-0.6% of funds under management annually. Whilst running platforms might not sound like a very glamorous business, it has been a lucrative area for the major financial institutions, which by virtue of their IT expenditure have been able to capture over 85% of this market. However, like financial advice, the dominance that the major financial institutions have enjoyed on the platforms is being eroded by smaller more nimble platforms such as Hub24 (1. see below note), Netwealth and OneVue. These platforms have been very successful in capturing market share from the big banks due to a combination of accessibility and the flow of financial advisers leaving the major financial institutions.

Not all good news

At first glance, vertical integration sounds like a solid way for banks to supplement banking profits in an environment of relatively anemic credit growth, rising capital requirements and government mandated superannuation flows. However, the events of the past few weeks demonstrate that the ownership of wealth management businesses by the banks do pose some risks.

Aside from the volatility in investment returns, wealth management businesses have delivered adverse headlines that could impact on an institution’s core banking business. Over the past few weeks we have seen financial services CEOs face the Royal Commission due to allegedly fraudulent behaviour and bad financial advice from the banks financial planners. Indeed, we have also seen the Treasurer flag the possibility of gaol time for bankers!

In 2017 Commonwealth Bank spent $437 million in advertising to build its banking brand. While AMP does not disclose in its annual accounts what it spends annually on marketing, we would be surprised if it was less than $100 million. One would have to imagine that a portion of the goodwill that this spend generates has been dissipated by headlines detailing malfeasance in these institutions’ financial planning, platforms and insurance divisions. The management teams at the major financial institutions must be concerned that unethical behaviour observed in the wealth management businesses should not spill over to damage their core banking brands that generate the bulk of their profits.

1. Disclosure: in April Atlas in partnership with Maxim Private have launched the Maxim Atlas Core Australian Equity Portfolio on the Hub24 platform.

Our Take

The major financial players have not built these vertically integrated wealth platforms (comprising advice, investment accounting and funds management) to see large amounts of value being “leaked’’ to service providers outside the network. This naturally creates strong incentives to recommend the house products over independent providers, or to favour house products over external products with similar or even slightly superior characteristics. As an investor in the major banks, we would prefer that they keep as much of the value in-house to boost payments to shareholders, however as an independent boutique investment firm, we also have a strong personal incentive to see the vertical integration model break down and for clients to seek out independent financial advisors.

Whatever the composition of the market, of utmost importance is that all financial service providers adhere to rigorous codes of ethical conduct, such as that of the CFA Institute as the unethical behaviour revealed by the Royal Commission damages public trust in the financial industry as a whole.

Short selling harder than you think!

Over the past week short selling has been a hot topic in the financial press after a noted US-based short seller released a very negative piece about listed fund manager Blue Sky Alternative Investments (BLA). This caused BLA’s share price to fall 50%, wiping $440 million from Blue Sky’s market cap. Short sellers are frequently derided as vultures, rumour mongers or un-Australian. However, in practice, shorting stocks is a difficult, stressful and lonely way to make money in the market, which is predominately skewed towards good news and wearers of rose-tinted glasses.

In this week’s piece we are not going to look at the merits of Blue Sky as an investment, but rather at the mechanics and issues around short selling equities. We see that much of the coverage on short selling over the past ten days reveals that many of those who hold strident opinions on short selling have only a limited understanding of how it actually works in practice.

Step one:  find a company with bad characteristics and a catalyst

In traditional long only investing the goal is to own good quality companies with honest management teams, clean balance sheets and solid future prospects. By contrast, when selecting a stock to short sell the desirable characteristics include companies with low or negative growth, high and increasing debt levels, a weak business model, over-valuation by a market, and possessing a shaky management team. However, a critical factor is the requirement for a catalyst; over-valuation or high debt in itself is rarely enough. In Blue Sky’s case it was the negative report from Glaucus. As very few investors have the luxury of lobbing a damming report from the sidelines and outside the regulation of ASIC and the ASX, we would look for events such as a potentially bad acquisition (preferably off-shore), heavy directors selling, or corporate turnover at management level.

Step two: Find the stock to borrow

Short sellers will then borrow stock from a stockbroker and sell it. They are essentially betting that the price of the target company will decline before they have to replace the borrowed shares by buying the stock back. This is often the step that is ignored in the financial press when talking about shorting a company’s stock, as it is wrongly assumed that investors can borrow stock to reflect their negative view on a company.

When borrowing shares to short sell an investor has to look closely at both the rate per annum that they are required to pay to borrow the stock, and where the owner is located geographically. The rate reflects supply and demand, and for most stocks is currently 0.5% per annum. For stocks where the shorting demand may be higher than the supply (such as Fortescue) the rate may be 15% or higher. In the case of small capitalisation or tightly held companies such as Blackmores, the short seller may be unable to borrow stock and thus cannot short sell.

In the case of Blue Sky, when we looked a week ago there was no stock available to be borrowed and the current short-sold position only represents 3 million shares, or 3.8% of the register. In a small and tightly held company such as Blue Sky most holders would not lend out their stock for short selling as to do so they would be providing short sellers with the ammunition to bet against their long position.  For example, BigUN – which is currently suspended on the ASX in February due to accounting irregularities – only had 500k of their outstanding shares lent out to short sellers, which is a mere 0.3% of the register. In the lead up to BigUN’s suspension as its share price was falling, the demand to short this stock would have been intense, but there would have been no stock available to be borrowed.

Step three: Dividends and Corporate Actions

The short seller is required both to return the shares to the owner when requested, and also to pass on any dividends paid. We also strongly prefer to borrow stock from foreign owners such as large index funds like Vanguard or State Street, as if you borrow stock from a domestic owner and a dividend is paid, short sellers are required to compensate the original owner for both the dividend and any associated franking credits.

What happens if the stock goes up?

If the short stock rises sharply, the lender will be required to give their broker additional collateral, or the broker will require the short seller to close out the short sale transaction before the planned timeframe.  A series of urgent requests to wire cash to your margin account to cover a short-sold stock that is rising sharply will test the mettle of even the most hardened short seller. In contrast, a long only position in a falling company can mentally be filed in one’s bottom drawer until it eventually comes good (or goes into administration).

This gives rise to the skewed payoff ratio from short selling, where the maximum gain is known (the stock falls to zero), but the maximum loss is theoretically infinite.

The Market can remain wrong longer than you can remain solvent

It would be wrong to view that short selling risky stocks is a smooth path to outperformance. Keynes, the father of modern macroeconomics, once famously said that “markets can remain irrational a lot longer than you and I can remain solvent’’. This quote particularly resonated with me after an unprofitable short selling of Fortescue prior to the GFC due to concerns about the over-valuation and debt situation of the company.

This trade was put on at $50 per share late 2007 and then was closed out at $70 four months later as the price continued to rise with no signs of slowing momentum. It was very painful to lose 29% in a short stretch of time; however, Fortescue peaked at $120 in June 2008 before falling back to $20 in December 2008. Whilst our investment thesis was ultimately correct, we were unable to handle the pain of a steeply rising stock and the associated unrealised losses and increasing margin calls.

Short squeeze

A “short squeeze” occurs when a heavily shorted stock rises sharply, forcing sellers to close out their position by buying back stock, thus causing further upward price momentum. Often when the market appears to overreact to a small piece of positive news, this is a short squeeze and it is similar to too many people trying to fit through a door.

For example, if JB-Hi Fi (currently 17% of the register have been “borrowed” by short-sellers anticipating that the price will go down) or Domino’s Pizza (18% of short) were to receive a takeover bid, the price would escalate sharply as short sellers look to cover their positions. A nightmare scenario would be a contested bidding war if you are short. In December 2017 we saw a short squeeze in Westfield when a bid from Unibail-Rodamco came through. However, unlike Dominos or JB Hi-Fi, the percentage of the property trust’s outstanding shares that we sold short was not a large amount, though we did see a spike in the share price that reflected the short sellers buying back stock to exit their positions.

Our Take

While short selling is often criticised and retains a negative connotation in a securities industry that is inherently biased towards optimism, we see that it serves a valid role in financial markets. Short sellers provide an alternative view and can aid both liquidity and price discovery in stock markets. In coming years – with MiFID II (new European regulations on stockbrokers) reducing the incentives for the investment banks to put out negative research and the decreasing value placed on sell side research – shorting will provide an alternative view. 80% of calls are buy or hold!

Investors should not look at situations like Blue Sky, BigUn or Slater and Gordon and view that it is an easy way to make money, nor that it is unfairly ganging up on a company. Even very experienced and adept short sellers such as Glaucus have made mistakes. For example, its shorts on Japanese trading house Itochu would have cost the fund manager substantially, with the price up +43% since they released their report in mid 2016.

Neither the Atlas High Income Property Fund nor the Maxim Atlas Core Australian Equity Portfolio currently employ shorting as an investment strategy. However, the author has previously managed a long short fund and has some understanding on short-selling as an investment strategy.

Splitting up with Coles, 1+1=3?

On Friday morning Wesfarmers announced that they are looking to demerge its Coles division to create a new ASX top 30 company, with leading positions in supermarkets and liquor. This move was very well received by the market, with Wesfarmers stock finishing up $2.60 or +6.3% on Friday, and over the weekend we have seen analysts upgrade their price targets for Wesfarmers.

The stated aim of this action is to reposition the Wesfarmers portfolio into businesses with higher growth prospects. Given Coles’ size and the concentrated market structure of the Australian grocery industry, Coles is likely only to grow at a rate similar to Australian GDP. In this week’s piece we are going to look at the Wesfarmers deal, and in particular at the rationale behind spinning out assets to form a new company.  Typically, CEOs are incentivised grow rather than shrink the size of the businesses they manage.

The Deal

Wesfarmers are proposing to demerge Coles into a stand-alone ASX Top 30 company, and existing shareholders will then own shares in both Wesfarmers and Coles. Shareholders will get a chance to vote on this action later this year with the deal expected to close in FY2019. The new company will consist of Coles and Liquorland, and Wesfarmers will retain a 20% stake in the newly-listed Coles as well as Bunnings, Kmart, Target, Officeworks, Flybuys, and the industrial and chemical companies. Critically, management expect that the distribution of Coles shares to WES shareholders will likely qualify for demerger tax relief.

Why are management doing this?

Coles operates in the highly competitive domestic food and liquor business and going forward their growth will essentially track Australian GDP growth. Currently Coles holds 33% market share of Australian supermarket spend and 16% of retail alcohol sales. Realistically it would be very hard for Coles to increase their market share meaningfully in either of these categories without provoking an immediate reaction from competitors Woolworths and Aldi. Fundamentally Coles is a stable, low growth mature business.

People more cynical than us might look at remuneration conditions for senior management in the Wesfarmers Annual Report and notice that a large portion of the CEO’s bonus is tied to delivering a high RoC (return on capital) and note that removing Coles could make it easier to hit those targets. For example, in the last six months, Coles delivered a RoC of 9%, whereas Bunnings Australia had a RoC of 47%! However, these bonus conditions may be adjusted to reflect the split.

1+1 = 3 ?

Prior to Friday’s announcement Wesfarmers had traded on a lower price earnings (PE) multiple that Woolworths, so spinning off Coles is expected to deliver a valuation uplift to shareholders. Assuming Coles trades on the same multiple as Woolworths the new company would be worth $22 billion. Prior to the announcement using an EV/EBIT (Enterprise Value divided by Earnings before interest and tax) multiple, the implied value of Coles was $18.5 billion. The uplift to shareholders from the announcement can be seen in the $2.9 billion lift in Wesfarmers’ market capitalisation on Friday.

The ignored child gets a new lease on life

The most common reason cited for a company demerging or “spinning off” a division into a separately listed vehicle is that the previously unloved division will now be run by management totally focused on it. The theory goes that as a result of this increased love and focus and not having to compete with other larger divisions for management attention and capital, the demerged division begins to prosper. Furthermore, management at the parent company benefit, as the more attractive “core” business is now re-rated upwards by the market and valued on a higher multiple. The sum of the two parts becomes greater than the original whole. We see this as one of the motives behind Wesfarmers spinning off Coles.

Recent examples of this type of strategy can be seen in Orica’s 2010 spin off of their paint division Dulux, Woolworths spin-off in 2012 of a portfolio of shopping centres into Shopping Centres Australasia Property Group, and BHP’s spin off of S32 in 2015. These three spin-offs have proved to be very successful with Dulux giving shareholders a total return of +251% vs Orica’s loss of -2%. Similarly Shopping Centres has returned +89% since it was spun out of Woolworths in 2012, against a total return to Woolworths shareholders of 12%. In May 2015 BHP demerged S32 to separate the core iron ore, oil, copper and coal assets primarily located in Australia, Chile and the US from the smaller aluminium, Columbian nickel, South African manganese, silver, and South African coal assets. Since listing, S32 has returned +50% to shareholders vs BHP’s gain of +9%.

From meeting with the new management teams of the above companies post their demergers, it was clear to me that they exhibited a great deal of pride in the results of their own smaller companies and relished controlling their own destiny outside the larger parent. Furthermore, as stand-alone companies both Dulux and S32 were able to make decisions to grow their businesses, moves that probably would not have been approved if they were still competing for capital with BHP’s and Orica’s much larger Australian mining and global mining services.

Getting rid of a problem

Whilst the above more recent spin-offs have all outperformed their parents, there have been situations where a company demerges less desirable businesses that they see might hold back the core business in the future.

BHP has previously spun off divisions in the past that they viewed as less desirable. In 2000 BHP demerged their long steel division (Arrium née Onesteel), and in 2002 their flat steel division BlueScope Steel. This was motivated by the view – which proved to be correct – that greater returns could be made from digging ore out of the ground and directly shipping it to China, rather than in manufacturing commodity steel in Australia. Furthermore, BHP was able to “spin off” the industrial relations headaches that are present in the heavily unionised steel manufacturing sector. Whilst BlueScope is currently performing well after some near-death experiences in 2011 and 2012, BHP’s long steel business Arrium went into administration in 2016.

Similarly, Amcor’s demerger of its paper low growth business PaperlinX in 2000 removed a significant management headache for the global packaging company, as the growth in electronic communications and data storage has caused a structural decline in the paper business.

Our take

Whilst the above suggests that spin-offs can unlock hidden value for shareholders, there are potential downsides. Running two separately listed companies results in Wesfarmers shareholders bearing additional costs of maintaining two separate listings on the ASX , such as two separate boards and management teams. The most consistent winners from spin-offs are the investment banks. BHP paid US$115M in fees to create South32 and the investment banks would be expected to earn similar fees from Wesfarmers.

Volatility and Melting Markets in February

Over the last two weeks investors have been bombarded with a range of financial commentary, some of which comes with the conclusion that investors should sell everything as we are facing price falls in 2018 similar to what happened during the GFC a decade ago. This intensified after the S&P 500 fell -3% on Monday, its biggest one-day fall since 2012.

In this week’s piece we are going to look at some of the factors behind February’s fall and subsequent market volatility, and how we approach investing during times when the Chicken Littles are suggesting that “The sky is falling in!”.

Setting the Scene: A shaky background in January
Prior to the market volatility in February, the stage appeared to be set for a correction. The US market had enjoyed a two year run without a major correction,  as the S&P 500 smoothly gained 54% from the 12th February 2016. In late January US stocks were trading at lofty valuations: the S&P 500 was trading on a price to earnings ratio of 21 times, fuelled by improving corporate profits and impending tax cuts.

However, the market was also concerned that if the US economy gets much stronger, we could see inflation, something that many younger analysts only dimly remembered from dusty economics textbooks. Finally, with the changeover in the leadership of the US Federal reserve occurring on the 3rd February, there was concern that the US Fed would drive up interest rates in 2018 and that this would be done too aggressively, triggering a fall in equities.

Low Volatility
Against this background, market volatility had declined to extremely low levels, as the share market enjoyed a prolonged period of smooth rally without a correction. Moreover, this low volatility extended to a range of assets including shares, currencies and bonds. The decline in volatility is something that we had observed over the past year, and which influenced income in the Atlas High Income Property Fund.

Whilst Atlas have been unhappy about the prices we have been receiving due to the low volatility, a range of hedge funds have been profiting from this phenomenon. Essentially this involves betting that stock markets would continue to remain benign. This is done by shorting the volatility of the market 1. Short volatility has been a very consistently profitable trade over the past year, collecting consistent premiums every few months from derivative positions that return a profit if the stock market does not swing wildly in either a positive or negative direction.

A Crowded Trade and the Stampede out the Door
At the end of January there was US$3 billion in exchange traded funds (  ETFs) in the US using this strategy. Amazingly two ETFs alone – VelocityShares Daily Inverse VIX Short-Term ETN, and ProShares Short VIX Short-Term Futures ETF – increased assets by US$1.7B between them in January 2018. After the first of these funds fell more than 90% in a week, Credit Suisse are in the process of shutting it down.

However, it would be incorrect to think that a few small funds alone contributed to the market falls we have seen in February. According to Bloomberg in the wider funds management universe more than $2 trillion of investments are linked to this short volatility strategy. These hedge funds are connected via systematic strategies such as short volatility, risk parity, and volatility targeting. This very profitable trade betting on low volatility soon became a crowded short, vulnerable to a short squeeze when a large number of traders are forced to try and make the same trade at the same time. A situation similar ten people trying to quickly leave a room through a doorway when a giant rat falls from the ceiling.

What we have seen over the past fortnight was the unwinding of a crowded trade, and the resulting squeeze. The market movement – as these funds unravel and hedge funds using these strategies see outflows – has fed into weakness in the underlying shares due to forced sales of equities.

 1. The short volatility trade involves two constituent parts; 

a) Initially selling longer-dated futures on the Volatility Index (VIX) which were priced based on the expected volatility of the S&P 500 a few months in the future. The VIX is itself derived from the volatility of options on the S&P 500 which are primarily derived from the recent volatility in the price action of the market itself.  Atlas have observed the declining volatility of markets over the past year, because as a seller of covered call options, the premiums we have been receiving for the call options sold have been declining.

b) As for the past two years up until February these futures in volatility traded above the current level of volatility or VIX, provided the market remains placid,  the short seller covers their short sales as the price of the future falls towards the spot price as the future expire.

Our take

Atlas considers that what we are seeing at the moment is the disconnect between the “financial economy” and the “physical economy” and an element of reality returning to stock market valuations.  At the halfway mark of the February profit-reporting season, the overwhelming theme is that both Australian and US companies are making healthy profits.

When a major market dislocation occurs, the best thing for investors to do is step back and think what this particular dislocation will do to the earnings and dividends from the companies held in their portfolio. If the answer is not much and the dividend stream will be largely unaffected, then the falling market has given you the opportunity to add to positions at a discounted price. This is markedly different to the conditions that investors faced ten years ago. At that time the seizing up of the credit markets both disrupted the ability of most global companies to refinance their debt, and also saw profits fall heavily as global trade declined sharply.

The Mining Cycle – Booms and Busts

Unlike industrial companies such as Amcor or Transurban, profits for mining companies are inherently cyclical. The  earnings from mining companies are subject to booms and busts, largely outside the control of their management teams. This occurs as ultimately any company producing a commodity is a “price taker” not a “price maker”,  as there is no difference or brand premium between a pound of copper mined in Australia or in Chile. Due to the nature of the cycle, we see that mining stocks should not be viewed as buy and hold forever. Rather, investors should pick and choose their entry points based on where they consider that minerals are in the mining cycle.

In this week’s piece we are going to look at the five different points of the mining cycle and where in the cycle Atlas perceive that commodities are currently positioned. The chart below shows the commodity cycles over the past 200 years, with the peaks coinciding with major wars or industrialisations of large economies.


1. Demand for commodities drives up prices
In the short term, supply is relatively fixed for most commodities as miners have optimised their mines for a specific level of production and minimal exploration during the lean times has run down ore reserves. At stage 1 of the cycle memories of the previous bust are still pretty fresh, and there is likely to be an under supply of personnel such as mining engineers. Additionally, the few surviving mining services businesses and contractors are likely to have minimal spare capacity which could allow production to expand quickly. Further, management teams in the mining companies are unwilling to greenlight capacity expansions until they become convinced that higher commodity prices are permanent.

In recent times this occurred in 2004 and 2005 as the industrialisation of China delivered a new buyer for Australian materials. This saw copper increase from $1 per lb in 2004 to close to $4 per lb in 2008 as supply was relatively static despite increased demand.

2. New Exploration undertaken to add to supply and Takeover activity surges

At stage 2 of the cycle, management teams at the mining companies are likely to be running existing mines at full capacity and have developed some confidence that elevated prices will persist for some time. This incentivises new exploration and capex is allocated to bring previously uneconomic discoveries into production.

At this stage we also see surging M&A as companies use excess capital built up in Stage 1 to buy growth which can be delivered faster through a takeover than developing new mines.  An example of this was the 2007 acquisition of Alcan by Rio Tinto for US$38 billion.

3. New mines start producing at the same time results in supply being greater than demand 

Due to the long lead times, in my observation a range of projects tend to hit the marketplace at almost the same time. Additionally, from speaking to resource CEOs during stage 3, each of them are invariably convinced that they have the best project and that rival projects won’t go ahead or get financing. Quite often a range of similar projects are all developed, with banks falling over themselves to provide finance them. Prior to stage 3 these projects look to be quite low risk with short payback times if prices are maintained (which they won’t be). Further, the costs of these projects are inevitably higher than originally forecasted due to the competition for scarce resources such as skilled labour and capital goods. A great example of this can be seen in the decision of Santos, Origin Energy and BG to construct three LNG gas projects simultaneously at Gladstone in Queensland.

The long lead times between development and first production can result in new mines coming online in market conditions quite different from when they were first conceived. A great example of this is Oz Minerals’ Prominent Hill Copper Mine which started being developed in 2006, and then came online 3 years later in 2009 at a cost of $1.2 billion. During the construction process the Copper price had fallen from $4 per lb to $2 per lb at the time of mine opening.  Similarly the US$10 billion Roy Hill iron ore mine started initial developments in 2011, with full production only being achieved in 2017.

Due to the debt burden generally incurred to develop projects, despite the fall in commodity prices at stage 3 of the cycle, many mines will boost production to cover their cash costs (including debt repayments), driving down industry margins. Given the cost of actually closing a mine (redundancies and break fees for contracts written with rail and equipment suppliers), most mining executives are reluctant to put their projects on care and maintenance to remove capacity from the industry. We saw this in 2014 and 2015 where a range of smaller Australian iron ore such as Atlas Iron and BC Iron were mining iron ore, yet were losing close to US$20 on every ton of their ore shipped, with the iron ore price at $50/t. Additionally, higher cost Chinese state-owned iron ore mines continued production despite losing money on every ton,  due to the perceived political imperative to maintain employment.

4. High cost and less efficient mines close and late cycle projects abandoned until next boom

At this stage of the cycle the canaries in the metaphorical coal mine are the contractors servicing the miners. In an effort to avoid the finality of shutting production, costs are pared back with the services businesses serving the mines the first to feel the pinch. Exploration budgets are slashed and expansion plans put on ice. These actions can push highly geared services companies such as Boart Longyear into administration. Larger mining services companies such as Downer tend to see large declines in profit as services are taken in-house by the miners and bull market contracts are re-written.

The next step at this stage is for the higher-cost producers to mothball their mines in an effort to conserve corporate cash and keep the company as a going concern. In 2015 a range of higher cost iron ore producers such as Atlas Iron, BC Iron, Arrium and Mount Gibson shut production, some of which have since been reopened. The more established mining companies at this stage will slash dividends (BHP in 2016) or raise capital to stave off worried bankers (RIO in 2009).

Complex late cycle projects that get deferred included Rio Tinto’s controversial Simandou iron ore project in Guinea which was shelved in 2016 due to concerns about the iron ore price. To develop this mine, Rio Tinto would have needed to construct both new 670-kilometre heavy freight rail line to transport iron ore shipments from Guinea’s Simandou Mountain range to the coastal city of Conakry and a sea port to load this ore onto ships. Despite the size and quality of this ore body, this would have been a risky and costly venture at this stage of the mining cycle.

5. Capitulation 

At this stage sustained falls in commodity prices forces a range of second and third tier miners into administration with ownership transferring from equity to debt-holders. The remaining lower cost miners going into survival mode, focusing in on conserving cash.  Exploration will stop, as excess supply is now expected to continue almost indefinitely.  Here a range of professionals such as mining engineers and resources analysts at investment banks will start to leave the industry.  The last part of this circle of life is the conversion of the ASX-listed shells of mining companies into “new economy” companies to speed up their listing process. For example, in the late 1990s the ASX-listed shells of the defunct mining and exploration companies from the 1980s  were reborn as “dot.com” companies.

Where are we now?

Every cycle broadly follows the curve, yet looks a little different when you are in the eye of the storm. Two years ago, in January 2016 it strongly appeared that we were in stage 4 and staring down the barrel of a long winter for commodities prices, but 2017 did not follow the expected script as commodities prices strengthened. This occurred due to China’s efforts to stimulate their property sector, slightly stronger growth in the developed world, and supply disruptions to mines such as Samarco in Brazil. Additionally, structural reforms in China aimed at reducing pollution and improving the quality of growth have increased demand for higher quality grades of commodities. 

The 2017 recovery in commodity prices has pushed us back into the mid cycle, though both companies and the investment community are very cautious. There are few new IPOs coming to market outside the exotic commodities linked to electric vehicles, minimal significant corporate takeovers being announced, and expansion activity remains subdued. In the upcoming February, reporting season will show very healthy mining company balance sheets which will hopefully result in improved returns for shareholders, rather than value destructive empire building. 

We are more cautious than most, as being pushed back into this favourable stage has occurred to some degree by the desire of the Chinese government to stimulate their property market. Chinese economic policies will not always favour Australian investors and a cooling Chinese property market (as breaks are applied) could have a chilling impact on commodity prices.