Dogs of the ASX …. Woof Woof!

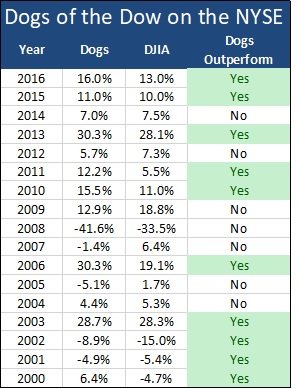
The “Dogs of the Dow” is an investment strategy that is based on buying the ten worst performing stocks over the past 12 months from the Dow Jones Industrial Average (DJIA) at the beginning of the year, but restricting the stocks selected to those that are still paying a dividend. The thought process behind requiring a company to pay a dividend  is that if it is still paying a distribution, its business model is unlikely to be permanently broken. The strategy then holds these ten stocks over the calendar year and sells them stocks at the end of December. The process then restarts, buying the ten worst performers from the year that has just finished. In this area retail investors can have an advantage over institutional investors, many of whom sell the “dogs” in their portfolio towards the end of the year as part of “window dressing” their portfolio. This avoids the manager having to explain to asset consultants why these unloved stocks are still in their portfolios.

In this week’s piece written from snowy Norway,  we are going to look at the “dogs” of the ASX, focusing on large capitalisation Australian companies with falling share prices. Additionally, we are going to sift through the trash of 2017 to try to discern any fallen angels with potential to outperform in 2018.   Unloved mutts
The Dogs of the Dow was made famous by O’Higgins in his 1991 book “Beating the Dow” and seeks to invest in the same manner as deep value and contrarian investors do. Namely, invest in companies that are currently being ignored or even hated by the market; but because they are included in a large capitalisation index like the DJIA or ASX 100, these companies are unlikely to be permanently broken. They may have the financial strength or understanding capital providers (shareholders and banks) that can provide additional capital to allow the company to recover over time.

ASX Dogs over the past five years
The table below looks at both the top and bottom performers for the past five calendar years and their performance over the subsequent 12 months. As always this is measured on a total return basis, which looks at the capital gain or loss after adding in dividends received.  Whilst sifting through the trash at the end of the year yields the occasional gem – such as Qantas in 2017 (+65%), Fortescue in 2016 (+223%), Qantas again in 2014 and Challenger in 2012 (+81%) – an equal weighted portfolio of the dogs of the ASX 100 has outperformed the index in three of the past seven years.


Themes
Looking at the above table, finding the fallen angel among the worst performers seems to work best where the underperformance is due to stock-specific issues, rather than macro issues beyond a company’s control. For example, Cochlear underperformed in 2013 after weaker sales as the company waited for approval to sell its new Nucleus 6 product in the United States. Subsequently, Cochlear’s share price has gained 240%,  as hearing implant sales bounced back. Similarly BlueScope Steel had a tough 2015, which saw the company seeking government support to help restructure their Port Kemba steelworks. Concurrently, cheap Chinese steel took market share at the same time as key inputs of iron ore and metallurgical coal were climbing upwards. 2016 saw a significant turnaround for BlueScope’s shares which gained +111% as profits recovered due to cost controls, stronger sales and the benefits of an acquisition in the United States.

The common factor among the underperformers that have continued their slide in the following year is when the underperformance is tied to factors outside the company’s control, such as a multi-year decline in a commodity. From the list of underperformers in 2014, continuing declines in iron ore delivered further pain to Arrium, Fortescue and BHP’s shareholders. Similarly, a several year slide in oil prices pushed down the share prices of Santos and Worley in the subsequent 12 months.

Unloved hounds as of December 2017
As a fund manager the key question is whether there are potential show champions in the breed of unloved canines tabled below for the 2017 calendar year. Unlike previous years a diverse mix of sectors are represented and there are more company-specific reasons for underperformance, which should yield more opportunities to pick some treasure out of the trash.

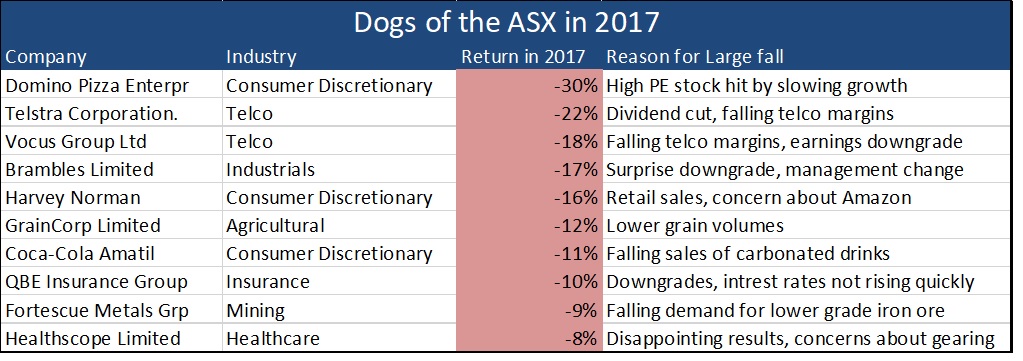
Looking at the two telcos Vocus and Telstra, it is tough to see the near term catalysts that will transform them into stars in 2018, with the NBN market likely to remain intensely competitive with high costs to migrate customers. Fortescue is likely to continue to face Chinese preference for higher grade iron ore over its lower-grade blends to improve furnace efficiency and reduce pollution. Domino’s Pizza could be a candidate for a turn-around in 2018, now the company is more reasonably valued with multiple avenues for growth across its discount pizza operations in Europe, Australia and Japan and a falling AUD will boost earnings. Similarly Brambles could see a brighter 2018 based on growth in US pallets, management stability and a falling AUD.


Our View
Whilst the Dogs of the Dow might work in a market populated with a diversified range of companies in uncorrelated industries such as McDonalds, 3M, Merck and Microsoft, it does not appear to be a broad strategy that one can use consistently in the ASX. We see that among the companies in the ASX 100, the composition of the index is not as broad as the Dow at an industry level. The ASX has a high weighting to resource companies, whose profitability is largely tied to commodity prices (such as oil and iron ore) that are outside of management’s control and can be subject to multi-year declines.

Nevertheless it can pay to sort though the dogs of the ASX. From the table above over the past 5 years, one of the top performers in the following year can be found by sifting through the dogs of the ASX100.


Earnings Chicanery Part Two

Last week in part one of Atlas’ surprisingly popular series on financial statement trickery – Earnings Chicanery, we looked at the three financial statements and some measures a company can take to “dress up” their financial results. In part two we are going to build on this and take a look at some warning signs that there may be problems with a company’s financial statements.

Red Flag 1: The statements don’t match

On results day most attention is focused upon a company’s profit and loss statement. In particular, analysts and commentators scrutinise whether the company has achieved the expected profit or earnings per share guidance, which was usually given at the last result. Whilst the profit and loss statement usually provides good guidance as to how the company has traded over the past six months, as discussed last week it is also the statement most open to manipulation and should be read in conjunction with the cash flow statement. It is a good idea to compare a company’s operating cash flow with its reported profits. If there is a big divergence, then the accounts should be examined carefully.

The red flag that we are looking for here is when a company’s cash flow statement and profit and loss statements are moving in different directions over an 18 month period, and where a company is showing growing profitability, but declining cash flows. In the below table from the 2015 accounts, Dick Smith Holdings reported income growing from $19 million to $38 million, yet operating cash flow fell from $52 million to -$4 million.  This suggests that the sales generating profits reported on the profit and loss statement were actually pushing the company towards administration.

Another recent example of this can be seen in Slater+Gordon. In the below table from their 2015 accounts, the company reported that 2015 financial year profits were up +6% to $84 million, yet their operating cash flow had deteriorated by -25% to $41 million. Here it appears that the company was overstating its profits through the accounting of its “legal work in progress”, and was overly aggressive in anticipating the expected cash generated through won cases. Whilst the company was able to deliver the earnings growth the market was expecting, in reality the declining incoming cash flows showed signs that it was actually a business in trouble.

However there are exceptions to the rule
The earnings on the profit and loss statement for some businesses can diverge from the cash flow statement. For example, a construction company such as Cimic (nee Leightons) or Downer might not physically be paid until July in the next financial year for work done on a railway project. Here the profits at a point in time may be greater than the cashflows, though the lumpiness of the cash flows received from large individual contracts will even out over time.

Red Flag 2: A company has consistent extraordinary
Extraordinary items are gains or losses included on a company’s income statement from unusual or infrequent events. Importantly, they are excluded from a company’s operating earnings. These items are excluded from earnings to give investors a more “normalised” view of how the company has performed over the period. For example, if an industrial company such as Amcor books a $50 million gain from selling excess industrial land, including this profit would obscure information about how the company’s packaging businesses have performed over the past six months.

While reporting extraordinary items can be valid and useful, investors should be wary or make their own adjustments to company earnings where a company has frequent (and almost always negative) extraordinary items that they are seeking to exclude from their reported profits.

As a long-term observer of the Australian banks, almost every year they put through a write-off of software below the profit line. In my view, investing in banking software is a core part of their business model and it seems curious that the institution is willing to take the productivity benefits in their normalised earnings whilst ignoring a portion of the costs needed to achieve these gains.

Red Flag 3: Divergence from comparable companies
The warning sign we are looking for here is when a company consistently has higher average profitability, revenue growth or better working capital management than their industry peers. Invariably when management is asked they will give an answer that relates to management brilliance or superior controls, but realistically mature companies operating in the same industry tend to exhibit very similar characteristics. As such, their financial statements should to some extent correspond to the statements of companies operating in the same industry. For example, supermarkets such as Woolworths should have a similar cash conversion profile to Coles (operating cash flow divided by operating profits) and not dissimilar profit margins as they are selling identical products to largely the same set of customers.

Hollow Logs?
Occasionally management teams may be incentivised to under-report profits in any current period. This generally occurs when a company is under heightened union scrutiny due to wage negotiations with their employees, excessive government attention from perceived excessive profits, or expects a problem in the next year and wants to smooth their profits. For example, in the current environment of extremely low bad debts a bank could be incentivised to boost their bad debt provisions aggressively. This action would reduce current period profits, potentially a politically astute move when politicians are calling for a Royal Commission into Australia’s banking sector. These excess provisions, if not required, could then be written back at a later date to boost future profits.

Our Take

Earnings misrepresentation is difficult for investors to detect from the publicly available accounts, but when revealed can sometimes have extreme results for a company’s share prices. In my experience this is more an art than a science, as the investor gets a sense that something is not right with the accounts, rather than definitive proof of earnings manipulation. Normally actual manipulation generally only becomes obvious ex post facto, after management has been removed or a company goes into administration.

Banks Reporting Season Scorecard 2017

Over the last ten days the major Australian banks have reported their financial results for 2017, reporting collective annual profits of $31.5 billion. In comparison to the May reporting season (which saw the surprise introduction of a 0.06% levy on the liabilities and $50 billion being wiped off the bank’s collective market capitalisation), the results were mostly in line with expectations. A key feature that we noticed was how efficiently the financial impact of this “game changing” levy or tax was passed onto borrowers, something that we expected when we looked at the bank results earlier this year in the May Reporting Season Score Card.

In this piece, we are going to look at the common themes emerging from the November reporting season, differentiate between the different banks and hand out our reporting season awards to the financial intermediaries that grease the wheels of Australian capitalism.

Across the sector profit growth was generally in-line with the credit growth in the overall Australian economy. ANZ reported headline profit growth of 7.6% when backing out the impact of the sale of the bank’s Asian retail businesses, Esanda and property gains from 2016. The solid profit growth displayed across the sector was achieved by improving economic conditions and lower bad debts. All of the banks reported lower trading income due to decreased volatility over the year.  During periods of higher market volatility, the banks can boost their income by both selling more foreign exchange and interest rate derivative contracts to their clients. However, they can also generate trading income by using their large balance sheet reserves to trade securities on the global markets.

Gold Star

Angry on costs: Reducing costs featured prominently in the plans of bank CEOs for the upcoming year, with much discussion about branch closures and headcount reductions. The removal of ATM bank charges and the migration of transactional banking from the physical bank branch to the internet is likely to deliver an efficiency dividend to the banks. NAB took the most aggressive stance, announcing that the bank will reduce its workforce by 6,000 employees due to business simplification and increasing automation. However, this will come at a cost with NAB expecting to book a restructuring charge of between $500-$800 million in 2018 and increases in investment spend by $1.5 billion.

Gold Star 

Bad debt charges still very low: One of the key themes across the four major banks and indeed the biggest driver of earnings growth over the last few years has been the ongoing decline in bad debts. Falling bad debts boost bank profitability, as loans are priced assuming that a certain percentage of borrowers will be unable to repay and that the outstanding loan amount is greater than the collateral eventually recovered. Bad debts fell further in 2017, as some previously stressed or non-performing loans were paid off or returned to making interest payments, primarily due to a buoyant East Coast property market and higher commodity prices. CBA gets the gold star with a very small impairment charge in 1st quarter 2018 courtesy of their higher weight to housing loans in their loan book. Historically home loans attract the lowest level of defaults.

Gold Star  

Dividend growth stalled but may return: Across the sector dividend growth has essentially stopped, with CBA providing the only increase of 9 cents over 2016. With relatively benign profit growth a bank can either increase dividends to shareholders or retain profits to build capital (thereby protecting banks against financial shocks); but not both. In the recent set of results the banks have held dividends steady to boost their Tier 1 capital ratios. Additionally, dividend growth has been limited as the banks have had to absorb the impact of the additional shares issued in late 2015 to boost capital.

Looking ahead, there may be some capacity to increase dividends (especially from ANZ and CBA after asset sales), as the rebuild of bank capital to APRA’s standards is largely complete. The major Australian banks in aggregate are currently sitting on a grossed-up yield (including franking credits) of 8.2%.

Gold Star

Net interest margins in aggregate increased in 2017, despite the imposition of the major bank levy. This was attributed to lower funding costs and repricing of existing loans to higher rates. In response to regulator concerns about an over-heated residential property market and in particular the growth in interest-only loans to property investors; in 2017 the banks have repriced these loans higher than those repaying both principal and interest. For example, Westpac’s currently charges 6.3% on an interest only loan to an investor, which contrasts to the 4.4% being charged to owner occupiers paying both principal and interest. This has had the impact of boosting bank net interest margins.

One of the key things we looked at closely during this results season was signs of expanding net interest margin (Interest Received – Interest Paid) divided by Average Invested Assets), and this was apparent even after allowing for May’s Major Bank Levy

Gold Star Australian banking oligopoly

Total Returns: In 2017 only NAB has been the top performing bank, benefiting  from delivering cleaner results, after it jettisoned its UK issues with spin-off of the Clydesdale Bank and Yorkshire Bank. CBA has been the worst performing bank as it faces both the imminent retirement of its CEO and the uncertainty around possible fines from foreign regulators for not complying with anti-money laundering laws. This has resulted in CBA losing the market premium rating that it has enjoyed for a number of years over the other banks.

Gold Star

Our Take

What to do with the Australian banks is one of the major questions facing both institutional and retail investors alike. The Australian banks have been very successful over the past few years in generating record profits, benefiting from lower competition from non-bank lenders and record low bad debts.  Looking ahead it is not easy to see how the banks can deliver earnings growth above the low single digits in an environment of low credit growth, increased regulatory scrutiny and the sale of some of their insurance and wealth management divisions.

Competition amongst the big four banks is likely to increase, as for the first time since 1987 (NAB’s purchase of Clydesdale Bank) we have no Australian banks distracted by foreign adventures, with all four focused on the Australian market.  However, looking around the Australian market the banks look relatively cheap, are well capitalized and unlike other income stocks such as Telstra should have little difficulty in maintaining their high fully franked dividends.

High Priced Shares

Earlier this week Macquarie Bank’s share price almost touched $100 after releasing a solid set of profit results and there was speculation in the press that Macquarie Bank would join Cochlear, Blackmores and CSL in having a three-figure share price. What was missing in these articles was the subsequent performance of other market darlings that have scaled these lofty price heights. Indeed, in a six-month period in late 2015 to early 2016 we saw Blackmores go from $100 a share to $220 per share, before sliding below $90 per share in in August 2017.

In this week’s piece we are going to look at over-valuation and reverse engineering the share price of two high flying stocks on the ASX; Macquarie Bank and A2M milk.

Price versus Value
Historically Australian investors have greatly preferred to invest in companies that have share prices below $10-20. My impression is that this is based on the logic that a 20c move in the share price has a bigger proportional impact, and that investors get more shares in the company when they invest. Fundamentally the actual dollar price per share means very little when deciding whether to buy or sell a stock. The decision is most often made by comparing a stock’s price with the expected profits and, ultimately, the dividends that you can expect as an owner of a fraction of the company. These expected cash flows are then discounted for both their timing and the risk of the company. This analysis derives a valuation that guides an investment decision. A $120 per share company could be much better value than one priced at $12 per share, if the expected dividends discounted for risk and inflation are higher than the price being quoted on the ASX.

Share price momentum
Often when a share price is rising in response to unexpected good news, underlying valuations tend to be ignored and risks glossed over. Analysts at both fund managers and the investment banks (including the author in his younger days) will tweak their valuations to justify why a strong performing stock is still worth buying, thus pushing the price higher.

Additionally, a range of quantitatively managed funds use momentum as a key factor in their investment strategy. Momentum investing is based on the principle that stocks that have been rising (or falling) in the past will continue to do so in the future. This strategy has nothing to do with the fundamentals of a company, but rather with the human propensity to extrapolate trends into the future. Active fund managers can also fall into the momentum trap, as good performance from owning these high flyers attracts inflows from investors that tend to be re-invested in these same stocks, creating a circular  loop.

Momentum tends to work well as an investment strategy until it abruptly  stops working. Like Icarus flying towards the sun, when these high-flying share prices melt there is often little valuation support.

What does the current share price imply?

One of the best methods I have used over the years to analyse expensive companies like Macquarie is to back-solve the earnings growth that the current $99-dollar share price implies. In other words, we reverse engineer the share price .

This model uses consensus earnings drawn from sell side analysts’ estimations of company earnings for the next three years. Whilst we recognise that broker earnings are inevitably too optimistic, they provide something of a base estimation of a company’s earnings power. Similarly, we use a terminal growth value of 2.5% in line with the estimated long-term growth rate of the economy.

Logically Macquarie Bank cannot grow towards infinity at 4% if the economy grows at 2.5%, otherwise as a matter of mathematical necessity it will become 99.9% of the Australian economy. Perhaps this would involve consumers buying Silver Doughnut branded cars, breakfast spreads, bread and beer, all funded by a Macquarie Bank mortgage. A chilling thought to most outside of Macquarie Bank’s Beaux-Arts revivalist-style Headquarters in 50 Martin Palace.

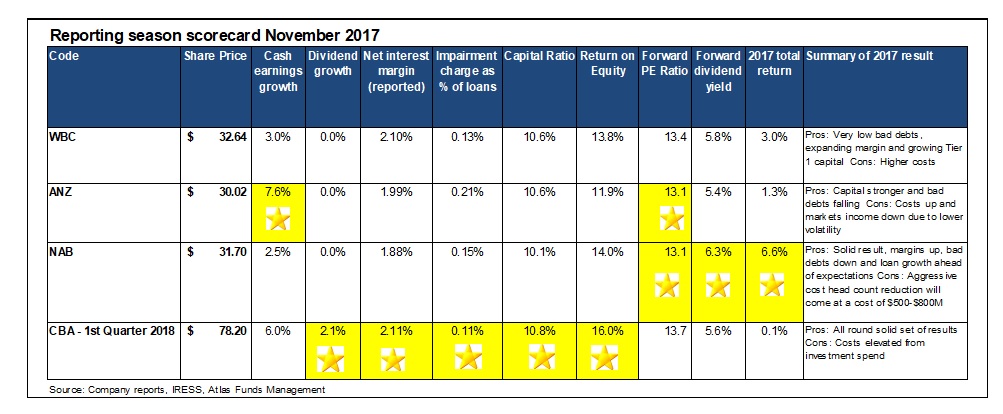
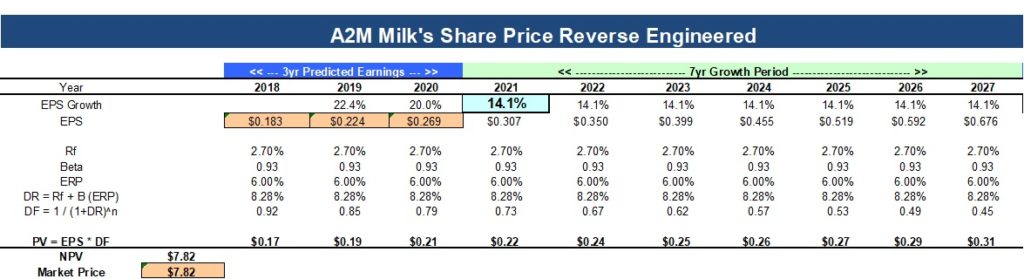
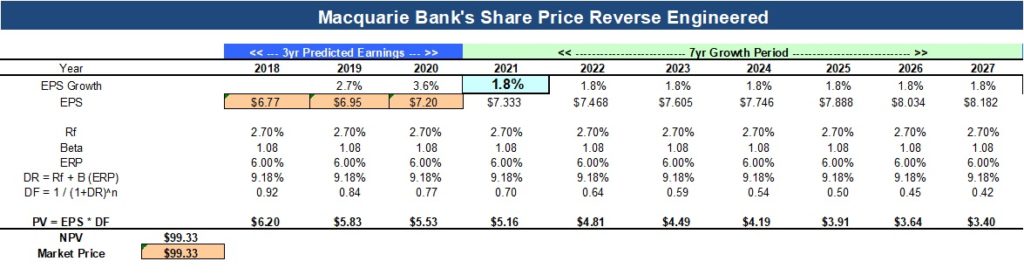
The above model suggests that Macquarie Bank’s profit growth needs to maintain a growth rate of just under 2% from 2021 to 2027 to justify the current share price. This is not unfeasible for Macquarie Bank. However, even if it executes well and expands its current A$482 billion assets under management, earnings are likely to be buffeted by external shocks over the next decade.

Milk and yogurt company A2M is a favourite holding of many fund managers and its share price is up a staggering 1,542% since listing in 2015. Currently the market sees such upside in the demand for A2M’s milk products that the company is trading on 41 times next year’s earnings per share. A2M is a company with a very solid growth prospects, however using the same model as we used for Macquarie Bank, A2M’s current share price requires a profit growth rate of over 20% for the next three years followed by 14% for the rest of the decade. Whilst it is far easier for a smaller company to achieve these compound growth rates, the current share price does not appear to allow for issues such as Chinese import restrictions or future manufacturing problems.

The growth implied by the current share price is a good sanity measure for investors. While even the best companies can deliver high earnings growth for a short amount of time, inevitably this growth falters either due to new competitors, management hubris or even the mathematics of compounding growth. Even for the m

ost wonderful company it is becomes progressively harder to grow those earnings at a high compounded rate, as the addressable market for a company’s products is always finite.
The last company to achieve a compounded growth rate of 10% over a 10-year period was Microsoft in the period ending 2004. Here the company benefited from the launch of Windows, Microsoft Office, Windows 95 and the global demand for computers spurred by a desire to access the Internet. Whilst A2M’s milk is gaining market share, it is hard to make the case that it will have as big an impact as Microsoft Excel.

Taxing Times

Earlier this month Atlas sent out the tax statements for the Atlas High Income Property Fund, and for a relatively straightforward fund with a simple tax structure (income is passed through to investors untaxed), I was surprised at the number of potential categories of income.

As this sparked a few questions in this week’s piece we are going to look at two relatively unique aspects of taxation in Australia and how some companies and in particular listed property trusts, can structure themselves to limit taxes paid.


Franking Credits
Franking credits (or dividend imputation credits) allow an investor to get a taxation credit at a personal level against the tax already paid at a corporate level on a dividend. Prior to the introduction of franking credits in 1987, the Australian Taxation Office (ATO) would tax both the company and then the investor on the same income, effectively doubling the tax paid on the same source of profit.  The franking credit regime was further sweetened in 2000, when changes were made that allowed investors on tax rates below the corporate tax rate of 30% to claim surplus credits as a refund. Prior to 2000 the ATO retained surplus franking credits.

The percentage of a distribution that is franked depends on the amount of tax paid by the company in Australia. For companies that earn all of their profits in Australia (such as Westpac for example) will be able to frank their dividends at 100%, whereas pathology company Sonic Healthcare can only provide frank their dividend at 20%. This is because most of Sonic Healthcare’s earnings are sourced from outside Australia. Some companies such as BHP build up large franking credit balances where they pay tax on the profits earned in Australia, but retain profits to fund capital expenditure to build and maintain mines, only returning a smaller amount to shareholders as dividends.  This franking account balance further accumulates when a company like BHP is also listed on a foreign exchange with investors that receive dividends without Australian franking credits.

Franking (or dividend imputation credits) are not a feature of global markets outside Australia and New Zealand, with only Canada, the UK and Korea retaining a partial imputation system.  This system encourages Australian companies to pay high dividends, whereas the tax system in the US encourages small dividends and share buy-backs as a means of returning profits to shareholders.

Why listed property trusts don’t pay franking credits

Listed property trusts such as GPT do not generate meaningful amounts of franking credits because they are structured to minimise the amount of tax they pay. Listed property trusts are a different corporate structure Act to industrial companies such as BHP under the Corporations and as a result they face different taxation treatment.

A company such as BHP is a separate legal entity that can hold assets in its own name. As a result, its shareholders do not own the company’s assets. The company’s board of directors can decide what dividend to declare (if any) on the company’s after-tax profits, after they have decided how much earnings to retain to fund expansion.

Alternatively, a trust such as GPT is a different legal entity where the trustee, holds the ‘legal’ title to their underlying shopping centre and office assets on ‘trust’ for the underlying investors, who hold the ‘beneficial’ title to those same assets.  Unitholders in GPT are thus the beneficial owners of the assets held and are entitled to the income derived from the use of those assets.

Consequently, a trust itself does not pay income tax on profits (rents less outgoings and interest costs), provided that over 90% of the profits of the trust have been fully distributed to the beneficiaries in the relevant financial year. The benefit of a trust structure is that it allows for the distribution of income to investors in a tax efficient manner, as unlike BHP (with its $13 billion-dollar franking credit account balance), a trust is a ‘transparent’ vehicle for Australian tax purposes as no tax is paid (in normal circumstances) by the trust Itself.

More Australian tax gymnastics: Stapled Securities

Continuing on with the theme of listed companies managing their tax, many listed property trusts are also “Stapled Securities”. Stapled Securities involve the binding or “stapling” together of two separate securities such as a share in a company and a unit in a trust which cannot be traded separately. This type of structure is used quite intensively in Australia by property trusts and infrastructure funds to shield their untaxed passive property income from the taxable profits earned by a management company.  Similar to franking credits this is a tax feature that is popular in Australia, but less so globally. Canada stopped the use in 2011 and the US in 1984. The rationale used by governments in North America for stopping stapled structures was to boost the tax take from corporations.

These corporate gymnastics is done for reasons of tax arbitrage. If stapling reduces the total tax bill paid on income generated by a particular business activity, shareholders benefit. Based on the time value of money rational investors would prefer a pre-tax stream of income and then pay tax at a later date on their personal tax rate, to payments that have already been taxed by the government from which the investor has to then apply for a refund.


In the above table if you own a unit of a GPT Group this is a stapled security comprises two separate assets for capital gains tax purposes; a General Property Trust unit and a GPT Management Holdings Limited share. These GPT securities are ‘stapled’ together and cannot be traded separately. The trust holds the portfolio of GPT office tower and shopping centre assets, while the related GPT Management Holdings company leases and operates these assets and manages any development opportunities.

In the case of GPT, because the General Property Trust is a “pass-through” trust for tax purposes, the income it receives is not subject to company tax, so long as paid out to unit holders. Stapled securities often make the rental payments by the Company for the use if the Trust’s assets high to minimise the Company’s taxable income (i.e. profits from funds management and developments). If GPT’s management and passive rent collecting entities were merged, GPT’s rental income stream would be taxed at 30%. However, in 2016 GPT paid a mere $14 million in tax on a pre-tax profit of $551 million.

Our Take

Australian investors face a more complex tax environment than is present elsewhere in the developed world.  Whilst as the fund manager it would be nice to provide franking credits on the quarterly distributions paid by the Atlas High Income Property Fund, it is certainly simpler to be able to stream the pre-tax income from both property trust distributions and call options sold to the underlying investors without taking out any tax.  Additionally, investors get the use of this pre-tax cash today, rather having to wait until after they have submitted their tax returns to get a cheque from the government.