Breaking Up

In late September Commonwealth Bank announced both the sale of its life insurance business and that they were looking at floating the bank’s funds management business Colonial First State GAM on the share market. Based on the strong performance of recent spin-offs investors are likely to have a close look at any initial public offering (IPO) of Colonial First State GAM. In this week’s piece we are going to look at the rationale behind spinning off assets to form a new company, and we will review the performance of recent company spin-offs from large companies such as BHP, Orica and Amcor.

What is a spin-off?

A spin-off occurs when a listed company parent separates a portion of their existing company into a second listed company and allots shares in the new company to existing shareholders based on their holdings in the parent company. In some situations, the parent company will also simultaneously issue new shares to new investors to broaden the shareholder base and allow the new spun-off company to begin life with a healthy financial position. In a spin-off, the newly created company takes a portion of the parent company’s assets, employees, intellectual property and debt. For example, in 2012 Woolworths’ spun-off 69 Australian and New Zealand shopping centres into a $1.4-billion listed property trust called SCA Property. Woolworths shareholders then received one unit in SCA Property Group for every five Woolworths shares held.

The ignored child gets a new lease on life

The most common reason cited for a company demerging or “spinning off” a division into a separately listed vehicle is that the smaller new firm will now be run by management totally focused on it. The theory goes that as a result of this increased love and focus and not having to compete with other larger divisions for management attention and capital, the demerged division begins to prosper.

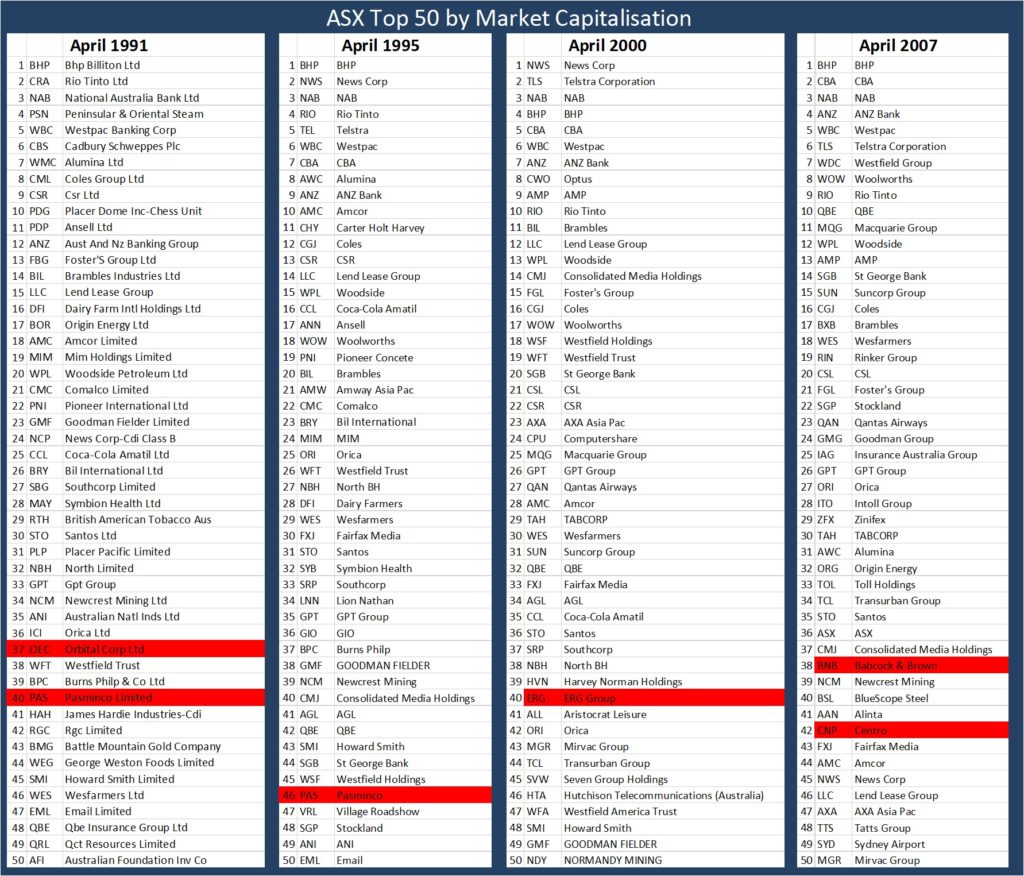
Recent examples of this can be seen in BHP’s 2015 spin-off of South32, Woolworth’s spin-off in 2012 of a portfolio of shopping centers into SCA Property Group, and Amcor’s demerger of its Australian packaging business Orora. These three spin-offs have proved to be very successful with South32 giving shareholders a total return (share price gain plus distributions) of +35% vs BHP’s gain of +16%. Similarly, SCA Property has returned +103% since it was spun out of Woolworths in 2012, against a total return to Woolworths shareholders of 8%. Since listing, Orora (which was viewed by the market as low growth compared to the dynamic world of global packaging) has returned to investors an impressive +198%: a healthy premium compared to Amcor’s still strong +68%.

From meeting with the new management teams of following their demergers, it was clear to me that they exhibited a great deal of pride in the results of their own smaller companies. Furthermore, as stand-alone companies they were able to make acquisitions to grow their businesses or buy back their stock on market. Such moves probably would not have been approved if they were still competing with Woolworths and BHP’s much larger Australian grocery and global mining business for capital.

Sum of parts worth more than the whole

In many cases the value of the two separate businesses is greater than the old combined business, even after accounting for additional costs such as a separate ASX listing and board. This is a benefit for shareholders of the parent company, as the more attractive “core” business is now re-rated upwards by the market and valued on a higher multiple. The sum of the two parts becomes greater than the original whole.

Looking at Commonwealth Bank and its fund manager Colonial First State GAM, the bank as a whole is currently being valued at 13.6 times the profits that it generated in 2017. Here the market is valuing the funds management earnings as if they were bank earnings, despite their higher margin. However, the market values stand-alone fund managers such as BT Investment Management (trading on 22 times earnings) and Janus-Henderson (trading on 15 times earnings) on higher multiples, reflecting the higher profit margins and low capital requirements for fund managers.  Using a mid-point of these valuations, Colonial First State GAM would be valued at $4.5 billion, an uplift from the $3 billion that their profits from 2017 are currently being valued as part of Commonwealth Bank.

Spinning off a management headache?

Whilst the above more recent spin-offs have all outperformed their parents, it would be wrong to see that all spin-offs from large companies make great investments. In some situations, a spin-off can be prompted by management foreseeing that a division of their business is likely to face issues in the future, that may spill over and impact their core business.

Arrium

BHP has previously spun off divisions in the past that they deemed less desirable. In 2000 BHP demerged their long steel division (Arrium née OneSteel), and in 2002 their flat steel division BlueScope. This was motivated by the view (which proved to be correct) that greater returns could be made from digging ore out of the ground and directly shipping it to China, compared to manufacturing commodity steel in Australia. Furthermore, BHP was able to “spin-off” the industrial relations headaches that are a feature of the heavily unionised steel manufacturing sector.

From listing up until 2008, BHP was criticised for letting go of their steel manufacturing businesses. It might face similar opposition to spinning-off South32, however often the genius behind this course of action does not become apparent for several years. Arrium was delisted in 2016 after a well-publicised insolvency. Whilst BlueScope has performed well over the last few years it still remains 74% below the issue price courtesy of dilutive capital raisings in 2011, and in 2009 required  to keep the wolves from breaking down the steelmaker’s doors.

PaperlinX

In 2000 Amcor spun off PaperlinX (now called Spicers) their stodgy printing papers division. However by 2003, Amcor was being criticised in the press after PaperlinX’s share price had risen from $3.17 at listing to $5.40. Concurrently, the PaperlinX was expanding globally after paying $1 billion to buy Europe’s largest fine paper merchant and became the world’s largest paper merchant.

The following decade was particularly unkind to PaperlinX investors as the paper business consistently shrank globally with the growth of electronic communication and document transfer technologies. Currently the company’s share price sits at 3.2 cents and one could make the case that Amcor’s management team, in spinning off a low-growth declining business, removed a division that would have consumed both shareholder capital and management attention. These negative factors ultimately would have arrested Amcor’s share price growth over the past ten years had they held on to their paper business.

Our Take

Whilst the above suggests that spin-offs can unlock hidden value for shareholders, there are downsides. Two separately listed companies result in the additional costs of maintaining two separate listings on the ASX such as two separate boards and management teams. We are likely to have a close look at any initial public offering (IPO) of Colonial First State GAM, especially on price weakness if a number of shareholders sell their entitlements just after listing. Unlike steel making or printing paper, funds management in Australia is a robust business and Colonial is a significant player with a powerful brand.


Why Institutional Investors avoid Residential Property

One of the misconceptions investors have is that the $123 billion dollar listed property index is primarily exposed to residential real estate. In fact, residential property comprises a small part of the index, with only 4% of the value of the index coming from trusts exposed to residential property. Further, this exposure primarily comes from developers selling finished apartments or home and land packages, not from actually owning housing real estate that is rented out.


Last month Mirvac announced they will be bringing Australia’s first major build-to-rent apartment development to market in a move that could potentially address housing affordability issues. In this week’s piece, we will look at why institutional investors have shied away from investing in residential developments, unlike in the US and the UK where this sector is a growing part of the Listed Property indices.

Residential property has attracted little interest from institutional investors as it is an area where retail investors have an investment edge. In the below chart, the grey bars show that exposure to residential real estate comprised 4% of the S&P/ASX 200 A-REIT index in September 2017, or $4.7 billion. This is dwarfed by the value of the discretionary retail ($59 billion), industrial ($25 billion), and office ($22 billion) real estate assets listed on the ASX. In comparison in the US, the residential sector accounts for around 25% of the $US2 trillion in institutional property investment, placing the sector just behind office.


Whilst the smaller transaction size of buying a two-bedroom apartment is attractive to retail investors (compared to an industrial warehouse or an office tower which may be valued in the tens to hundreds of millions), there are three structural reasons why retail investors dominate residential property investment.

Capital gains tax “crowds out” corporate investors

Although the domestic rental sector exists  in LPTs in the US and Europe, in Australia the tax-free status of capital gains for owner-occupiers selling their primary dwelling has had the effect of bidding up the purchase prices of residential real estate. For example, when a company generates a $500,000 capital gain from selling an apartment, they would approximately be liable to pay approximately $108,000 in capital gains tax, whereas the owner-occupier pays no tax on the capital gains made on a similar investment. This discrepancy in the tax treatment allows the owner-occupier to pay more for the same real estate assets, and thus has contributed to the low yields mentioned below.

Negative gearing

Similarly, individual retail investors benefit from the generous tax treatment in Australia that allows them to negatively gear properties. There are three types of gearing depending on the income earned from an investment property: positive, neutral and negative. A property is negatively geared when the rental return is less than the interest repayments and outgoings, placing the investor in a position of losing income on an annual basis. However, under Australian tax law, investors can offset the cost of owning the property (including the interest paid on a loan) against other assessable income. This incentivises individual high-taxpaying investors to buy a property at a price where it is cash flow negative in order to maximise their near-term tax returns and bet on capital gains. Whilst companies and property trusts can also access taxation benefits from borrowing to buy real estate assets, a rich doctor on a top marginal tax rate of 47% has a stronger incentive to raise their paddle at an auction.

Yields on residential property too low

At current prices, the yield that residential property offers are not very attractive for listed vehicles. At the moment, the ASX 200 A-REIT index offers an average yield of 5%. This compares very favourably with the yields from investing in residential property. SQM Research reported recently that the implied gross rental yield for a 3-bedroom house in Sydney of 3% with a 2-bedroom apartment yielding  4% in July 2017. After borrowing costs, council rates, insurance, and maintenance capex, the net yield is estimated to average around 1%. With listed property investors focused on yield receiving on average ~ 5% from property trusts investing in office towers and shopping centres, such a low yield would only be accepted if it was offset by high and certain capital gains.
Mirvac’s new “build to rent” fund

In August Mirvac announced their intention to develop a build to rent fund with assets based initially in Sydney. This fund is likely to be targeted at institutional investor, rather than retail investors, who generally already have a significant exposure to residential real estate. This looks to be an opportunity for Mirvac to access both development profit (profit margin +25% in FY17) and also an ongoing funds management fee on the completed assets. However, we would be surprised to see much of Mirvac’s own capital invested in the fund. In 2017 Mirvac generated a 18% return on the $1.8 billion of capital invested in its residential development business (ROIC). Mathematically it is hard to see how investing in their own finished product will generate returns higher than the trust’s average cost of capital.

Our take

Whilst the residential sector is a large part of the overall stock of Australian real estate assets, without significant taxation concessions it is hard to see this sector garnering much interest from institutional investors, especially for income-focused investors such as Atlas Funds Management. The Atlas High Income Property Fund’s strategy of populating the portfolio with higher quality domestic rent collectors combined with a derivative overlay strategy to enhance income should continue outperform in a property market that is trading sideways. We see that the majority of returns over the next 12 months will come from distributions and income from writing call options over existing holdings, rather than spectacular capital gains.


What we have learned from reporting season

During the months of February and August every year, the majority of Australian listed companies reveal their profit results and most provide guidance as to how they expect their businesses to perform in the upcoming year. Whilst we regularly meet with companies between reporting periods to gauge how their businesses are performing, during reporting season companies open up their books to allow investors a detailed look at the company’s financials. As company management have been on “black out” (prevented from speaking with investors) since mid-June, share prices in the six weeks leading up to the result are often influenced by rumours and theories, rather than actual financials.

Yesterday marked the final day of the August 2017 reporting season. Those listed companies that have not reported their results are probably suspended from trading today, inevitably blaming accountant incompetence or coming up with creative excuses for the ASX as to why they were unable to submit their accounts. In this piece, we are going to run through the key themes that have emerged over the last four weeks and how our companies have performed.


Growth

August 2017 was a pretty solid reporting season with Australian listed companies (ex resources) reporting earnings growth of +6%. This expands to +17% profit growth when you include the miners that have benefited from high commodity prices courtesy of a 2016 Chinese stimulus plan.  Whilst 6% might not sound very impressive, it is a big jump on the paltry +0.2% recorded in August 2016. Having listened to close to eighty management presentations over the past four weeks, the general tone feels more positive towards the future than it has been in recent years. This sentiment can be seen in the aggregate guidance for industrial companies for profit growth of +5% over the next 12 months.

No room for disappointment for high priced market favourites

One of the key themes coming out of this reporting season has been the harsh treatment meted out to high price to earnings (PE) stocks that deliver less than market expectations. Pizza/tech company Dominos Pizza (-18%) was priced on a PE of 60x but fell heavily after delivering only 28% earnings growth. Similarly, the market was unhappy with hospital operator Healthscope (-15%) which was trading on a PE of 22x and was sold off after reporting a 6% decline in profit due softer revenue growth from the company’s private hospitals  and project delays.

Whilst not a high PE stock, Telstra (-8%) is a core part of the portfolio for many retail investors who sold down their holdings after the company announced that they would cut their 2018 dividend to 22 cents per share from 31 cents per share.

Giving money back to shareholders

Capital management was again a prevalent factor in the recent reporting season and was understandably of interest to investors, more so in 2017 than it has been in recent years. We considered this topic in our recent pieces Give me my money back and bad and fake buy backs . In our view, the factors contributing to the 17 large companies that announced buy-backs in August are the perceived lack of investment opportunities, the level of balance sheet repair (paying off debt) that has occurred over the past few years, and the capacity for a buy-back to direct investor attention away from issues a company might face, thereby supporting the share price.

Treasury Wine (+19%), S32 (0%), Qantas (+7%), Rio Tinto (+5%) announced new share buy-back plans that have had a positive influence on their share prices. Alternatively, for BlueScope (-18%), and Dominos (-18%) investors looked past the carrot offered by the buy-back.

Whilst buy-backs boost share prices in the short term, in the longer-term companies do need retain cash to reinvest in their operations in order to grow earnings in the future without adding to debt.

Paying off the mortgage

In an environment of stronger than expected cash flows, companies either have the option to return money to shareholders in the form of higher dividends, or pay down debt. Whilst balance sheet repair has been a feature over the past two years, this reporting season showed several companies making big moves to pay down their debt. BHP (+6%) resisted the urge to follow Rio Tinto’s lead in announcing a buy-back funded by the sharply increased profits from high commodity prices. Instead management reduced the company’s debt burden from US$26.1 billion to US$16.3 billion.  This action did however come at a cost, with BHP paying several hundred million in fees for the early redemption of bonds.  Similarly, high Australian electricity and gas prices and asset sales allowed Origin Energy to reduce net debt by A$1 billion to A$8.1 billion.

Best and worst results


Over the month the best results were delivered by Treasury Wine, Alumina, Orora, IOOF and Medibank. The key theme amongst this diverse group of companies all in different industries was a strong profit result and expanding profit margins combined with a positive outlook for 2018.

On the negative side of the ledger Vocus, Dominos, BlueScope, Healthscope and QBE Insurance all reported disappointing results compared with other companies. The common themes amongst this group was either high price-to-earnings rated companies not delivering on high expectations, or companies that had downgraded expectations and then delivered results that were worse than the lowered expectations.

How have we gone

Whilst stock prices were volatile late in the month due to concerns over the launch of North Korean missiles, for the companies owned by the Atlas High Income Property Fund, August revealed a generally benign set of financial results. Using a weighted average, portfolio companies delivered earnings growth of +6% and grew distributions by an average +3.7% over the previous year. Additionally, 4 of the 12 trusts in the portfolio announced buy-backs.


Not all Great Ideas turn into Great Companies

In my experience, most professional fund managers and equity analysts are frequently given unsolicited stock ideas from clients and friends. Generally, these are small companies, with a great idea that is either going to turn them into the next Amazon or revolutionise a particular industry.  Frequently these companies are difficult for investment professionals to value as they are often at a very early stage. They tend to be long on promise, but short on profits and assets that provide the basis of most valuation methodologies. Inevitably the person presenting the idea knows much more about the exciting technology behind the company and is very enthusiastic about its prospects.

In this week’s piece, we are going to look at the processes and questions that investors should ask when looking at early-stage listed companies.  Atlas is not endorsing any of the companies mentioned in this piece, they are only mentioned in the context of the process that we use in evaluating early-stage companies.

1. How much runway do management have?

The first thing that I look at when reviewing one of these speculative companies is how much time or financial runway management has in which to commercialise their idea before running out of cash. Whilst companies can look to raise additional equity to extend this runway, this is almost always done at a discount to the prevailing share price and relies on supportive investors. Few early-stage companies are financed by debt, as the interest rates charged are likely to be high to compensate for the risk of lending to an unprofitable company.

Investors should look at the company’s cash flow statement to gauge how much cash the company has been burning for the past six months. Compare this against how much cash is on hand on the balance sheet. The reason for using the cash flow statement is that this represents actual cash flows and is harder to manipulate than the profit and loss statement. For example, when I looked at cloud call recording software company Dubber in February, the company reported a cash burn of $4M in the previous six months, yet had $5.2M cash on hand. Here unless there is a dramatic change in the company’s fortunes, one could expect another equity raising within the next 9 months.

Conversely, technology company Fastbrick Robotics had no debt and $10M of cash on hand. This is sufficient to fund the company’s development of a bricklaying robot beyond 2019. Without making any judgement as to the relative investment merits of the two companies, the second company has more flexibility to weather delays, without coming to the market to raise more equity to keep afloat. Obviously, the spectre of near-term equity raisings provides a cap on a company’s share price, as outside investors know there will be discounted share issues in the future.

In more extreme circumstances, the lack of a financial runway has seen companies with solid ideas or assets going into administration, with these assets later picked up by competitors.

2. Management’s record and shareholding

The next step is to look at the experience of management and board of the company in question.  Here what I am looking for is not so much experience at large and well-known corporations such as General Electric or Westpac, but rather experiences in guiding small and more financially unstable companies through to an IPO or trade sale. Large companies have little difficulty in getting attention from potential investors or banks and managing cash flows. Additionally, executives from large organisations are unlikely to have had experience of running a number of business areas while also having a laser-like control of costs.  Looking at job management software GeoOp, it was apparent that the chairman and CEO have solid experience in the digital space and in running start-up ventures.

Additionally, investors should look at the percentage of the company owned by management, as a management team with a significant portion of their personal wealth invested in the company are more likely to act as good agents on behalf of the other shareholders. Here investors should look at existing holdings, as well as the share options granted when management hit certain targets such as profitability and specific share prices.

3. Who else is on the share register?

The presence of larger corporations or well-regarded fund managers on a fledgling company’s share register should be viewed as a good sign. This can indicate that others have done the due diligence on the company, and it is often helpful that they have the voting firepower to stand up to management and scrutinise decisions. The presence of competitors or corporations in similar industries could indicate the possibility of a takeover at a later stage. In the Dubber example mentioned above, the presence of small capitalisation manager Thorney on the share register at 6.4% is a positive sign.

However, the presence of well-known fund managers on the register should not by itself be viewed as sufficient grounds for investment.  Most if not all small capitalisation fund managers have positions in their fund that they now regret and may be quite illiquid at the size of their investment. What may seem to be a significant investment for an individual investor may only represent 0.25% of a large fund.

4. Who are the Company’s competition and what is the size of its addressable market?

All successful small companies face the spectre of competition from large industry players. In some cases, large competitors may be watching the target company closely, learning from their mistakes, before launching a competing product or technology drawing on the larger company’s scale and market access.  Whilst “disruptive” financial technology companies or fintechs are very much flavour of the month at the moment, I find it hard to believe that the big banks and insurance companies are not keeping a close watch their activities. A great example of this is mobile payments company Mint Payments which in 2013 went from 2c to 40c per share on expectations that the company’s wireless point of sale would enjoy spectacular growth. The share price has slid back to 6c as the banks and technology companies such Apple launched competing payment products.

When looking at the prospects for a company and its potential growth, it is important to look at the size of the market to which its products can be sold. A small niche market might not attract competition from larger players, but significant share price growth is unlikely to come from dominating a very small market. Additionally, investors should be wary when a company suggests that it has no competitors, often this is a case of no competitors yet.

5. What barriers to entry are there?

A small company’s prospects of enjoying significant share price gains are significantly decreased if there is little in the way of barriers to stop other firms from entering into their industry. The technology sector in particular has been an elephant’s graveyard of large companies laid low by smaller, more nimble competitors that jumped over the low barriers to entry.  Examples of once exciting companies that only had low barriers to entry include AltaVista, Netscape and Myspace.

Recently we looked at social media marketing company VAMP that was planning on listing on the ASX and was backed by high profile Nova Scotian Qantas and Fairfax Media director Todd Sampson. The social media marketing firm had an exciting buzz as it was designed to capitalise on growing demand from advertising agencies and high-profile consumer brands to connect with Instagram ‘influencers’. However, on reflection, this particular antediluvian fund manager thought that the barriers to entry into social media marketing are quite low.

Our Take

Whilst most small companies have an exciting good, technology or concept that is inevitably presented in a form that will result in large gains in the share price, we see that it is helpful for investors to have a five-point checklist to look at when evaluating a small, exciting, yet unprofitable company. Atlas would like to thank our supporters whose ideas helped in writing this article.

Faded Blue Chips – solid stocks with feet of clay

Blue Chip stocks are the large well-established household names, in the top 50 companies listed on the ASX with a market value in the tens of billions. Stockbrokers recommend these companies to their clients based on the perception that they are safe and stable and following the axiom “Nobody ever got fired for choosing IBM“. They are viewed safe for advisors to recommend even if they fall in value. However, like Ozymandias in the poem by Shelley, strong and financially sound companies are not always permanent and can become buried in the Egyptian desert like the statue of the pharaoh.

“I met a traveller from an antique land, who said— “Two vast and trunkless legs of stone

Stand in the desert.  Near them, on the sand, Half sunk a shattered visage lies, whose frown,

And wrinkled lip, and sneer of cold command, tell that its sculptor well those passions read

Which yet survive, stamped on these lifeless things, the hand that mocked them, and the heart that fed;

And on the pedestal, these words appear: My name is Ozymandias, King of Kings; Look on my Works, ye Mighty, and despair! Nothing beside remains. Round the decay of that colossal Wreck, boundless and bare, the lone and level sands stretch far away.”

Shelley’s Ozymandias 1818

In this week’s piece, we are going to look at blue chips on the ASX over the last quarter century, the factors that caused them to decline and some thoughts on the current crop of “blue chip” companies on the ASX and their permanence.

What is a blue-chip stock?

The term “Blue Chip Stock” was first used by Oliver Gingold of Dow Jones in 1923 and referred to high priced stocks. “Blue” was a poker reference, as in poker sets the highest value chip is traditionally the blue one. Since then the term has come to denote high quality stocks, with consistent revenue growth and dominant market positions in their industry. They typically have a stable debt to equity/interest coverage ratios and generate superior return on equity (ROE).  Over time this translates into a high market capitalisation that places a company in the Top 50 companies listed on the ASX. Currently the smallest stock (BlueScope Steel) in the ASX Top 50 has a market value of almost A$7 billion.

The below table looks at the Top 50 stocks on the ASX by market valuation in four points in time over the last 26 years. There are many familiar names such as BHP and Westpac that were considered blue chips in 1991 and retain that status today, but there are also many that would be unfamiliar to many investors today. Whilst most of these (Cadbury Schweppes, North Broken Hill, PNO, Dairy Farm Holdings) have disappeared from the share market due to being taken over by other companies, in each period there are a number of supposed blue chips that ultimately went into administration or faded away to a small fraction of their previous size. The faded blue chips in the table are coloured in red. We will now examine the factors that contributed to their declines.

Too much debt

In early 2007 shopping centre trust Centro Properties was riding high after making a string of acquisitions in Australia and the USA. It was viewed as highly innovative, dubbed the Macquarie Bank of Property Trusts due to its use of debt to create a global property empire. After acquiring a portfolio of 469 small shopping centres across 38 US states for A$3.9 billion, the trust was managing A$26 billion of property. As a result of the acquisition, Centro Properties upgraded its forecast 2008 financial year distribution growth to 19%. However instead of rising distributions, in December 2007 Centro Properties faced significant problems in refinancing US$5.5 billion of debt that was due in a very challenging market. Additionally, the shopping centre owner faced questions about the accuracy of their financial accounts after billions of dollars in short-term bridging debt was classified as long-term debt. As a result of asset write offs, Centro Properties in June 2009 reported a negative net tangible assets (NTA) of -$2.23 per share (it was trading at $0.16 per share at the time). Ultimately equity holders were essentially wiped out as the mountainous debt burden was converted into equity.

Financial Engineering

In 1998 zinc miner Pasminco was one of the premier global zinc miners after buying the Century project from Rio Tinto. The company developed an audacious hedging strategy to lower debt costs by borrowing in USD and hedged the currency based on the expectation that the AUD would remain between US68c and US65c. Unfortunately, the AUD/USD fell to below 51c in 2001 at the same time that the zinc price crashed. This left the company with limited cash flow and losses on the hedge book that blew out to $850 million when the company went into administration in late 2001.

The combination of too much debt and financial engineering

No discussion of faded blue chips would be complete without looking at investment bank Babcock & Brown. At its peak in June 2007, the investment bank was lauded as a creative user of financial structuring and a fee-generating machine that propelled the company’s share price to $34.63, with a market capitalisation above $9 billion. From meetings that I had with Babcock & Brown management prior to the GFC, they also made no secret of the fact that only a small amount of their earnings could be characterised as “recurring” and that most of the profit (used to pay dividends) was generated by revaluing assets cannily acquired by the company.

Similarly, to Centro, Babcock & Brown both entered the GFC with too much debt and – more importantly – too much short-term debt that needed to be refinanced in a challenging market. In June 2007, the Babcock & Brown group had amassed $80 billion in assets, supported by $77 billion in debt, much of this held off balance sheet or characterised as “non-recourse” and held by satellite funds.  The company collapsed in 2009 after a falling share price triggered debt covenants and the company was unable to refinance the debt due. Ultimately, in very complex liquidation proceedings the noteholders ended up receiving 2c in dollar for bonds held, with equity holders receiving nothing.

Technology that did not work as expected

The orbital engine was invented by Ralph Sarich in 1972and at one time was expected to revolutionise combustion engines, with fewer moving parts and greater efficiency.  In 1991, the future for Orbital – a company that owned the technology for orbital engines – looked bright and BHP took a 25% stake in the company. Despite this promise, a range of technical problems with cooling and lubricating the engine proved unsolvable and both the founder and BHP ran for the exits. Orbital still exists selling fuel injection technology and propulsion systems for drones, but with a share price of $0.59 which is a long way from its peak at $24.

ERG’s future looked bright 17 years ago and was a glamour tech stock listed on the ASX offering smartcards for mass transit systems from Moscow to Manila. Whilst the technology itself was sound the company was effectively sunk, not by the offshore moves but by difficulties in implementing the ERG’s T-Card in Sydney and issues with the NSW State Government which led to the project being scrapped.  Ultimately this resulted in lawsuits and the company was delisted in 2009.

The above table shows the ASX Top 50 as of April 2017 ranked by market capitalisation.  Whilst it is usually hard to identify at the time which strong companies will falter in the future, history strongly suggests that amongst this list there are one or two companies, currently considered blue chips that will either go into administration or slide back into insignificance. Below we identify some considerations that might influence the future fates of current blue chips.

High Debt

In 2013 Fortescue looked like a candidate for a blue chip that might blow up, with 70% gearing resulting from $10.5 billion in net debt. However, a period of sustained high iron ore prices has allowed the company to pay off $6.5 billion in debt and reduce gearing to a more manageable 30%.

Amongst the blue-chip stocks in the table above, the companies with the highest debt burden as measured by gearing (net debt divided by total equity) are Sydney Airport (770%), APA Group (242%), Transurban (225%) and Ramsay Healthcare (135%). The key characteristic of these heavily geared companies is the view that the stable returns from airports, pipelines, toll roads and hospital procedures affords the ability to service high levels of debt.

Whilst these companies own wonderful assets and point to both the spread of debt maturities and their interest rate hedges (which lock in a portion of the company’s debt at a fixed rate), these hedges will expire and debt currently attracting low rates will almost certainly have to be refinanced at higher rates. For example, in the five-year period 2020 to 2024, Sydney Airport will have to refinance on average $806 million in debt per year.

Technology does not work as expected

Whilst we do not consider this likely and believe that the company has instituted many safeguards, blood therapy company CSL does face the risk of product recalls through contamination. In 2008, CSL’s rival Baxter faced a product recall after 81 deaths were linked to tainted blood thinning drugs produced under contract in China, but sold in the US under Baxter’s name.

 Left Field

Political factors could potentially derail BHP spin-off S32, which has climbed into the ASX Top 50 courtesy of higher coal and manganese prices. In February S32 reported that 35% of their profits were earned from the company’s coal and manganese mines and aluminium smelters in South Africa and Mozambique. Significant political unrest, power disruption from Eskom or amendments to South Africa’s 2002 mining charter requiring higher percentages of black ownership could result in significant falls in S32’s share price.

Our Take

We see that investors spend far too much time trying to pick the next Apple or CSL and not enough time thinking about whether there is a Pasminco lurking in their portfolio. Rather than chasing high return and higher risk investments, Atlas observes that superior performance and lower volatility of returns are best delivered by concentrating on avoiding mistakes or “performance torpedoes”.  Looking at the current list of blue chip stocks, we consider that the most probable candidate to become a fallen angel is likely to come from the list of highly geared utilities.